diag captureSlowFrame: Difference between revisions
Jump to navigation
Jump to search
Killzone Kid (talk | contribs) (screenshot added) |
mNo edit summary |
||
| (44 intermediate revisions by 5 users not shown) | |||
| Line 1: | Line 1: | ||
{{ | {{RV|type=command | ||
| arma2oa |= | |game1= arma2oa | ||
|version1= 1.63 | |||
|1. | |game2= tkoh | ||
|version2= 1.00 | |||
| | |game3= arma3 | ||
|version3= 1.00 | |||
|branch= diag prof | |||
| | |gr1= Diagnostic | ||
| | |gr2= Performance Profiling | ||
| | |descr= [[File:CaptureSlowFrame.jpg|right|200x120px]] | ||
Opens "capture frame" dialog if current frame exceeds set threshold in seconds. One can indicate to either capture duration of a specific profiling selection or the total duration of the frame. | |||
The selection names can be obtained by expanding the profiling tree. Clicking on a tree item will highlight the item on the graph and vice versa. | |||
The GUI also provides method of copying of the displayed data to clipboard. Some of the selections: | |||
{{{!}} class="wikitable valign-top-row-2" style="margin: 1em auto" | |||
! Render | |||
! Main Thread | |||
! Visualize | |||
! Mjob | |||
{{!}}- | |||
{{!}} | |||
* bgD3D | |||
{{!}} | |||
* total | |||
* memAl | |||
{{!}} | |||
* visul | |||
{{!}} | |||
* Mjob | |||
{{!}}} | |||
| [[ | {{Feature|informative| | ||
'''Chrome export format''': | |||
Capturing to file also creates a .trace file, which can be imported into chrome://tracing (in chromium based webbrowsers), or https://ui.perfetto.dev/ <br> | |||
The same format can be exported by pressing the "COPY ALL" button, in the capture frame UI, with {{Controls|Ctrl}} key being held down. | |||
}} | |||
|s1= [[diag_captureSlowFrame]] [section, threshold, frameSkip, toFile, continuousCounter] | |||
|p1= section: [[String]] - case-sensitive | |||
|p2= threshold: [[Number]] - section duration in seconds. 0 captures always '''IF''' the section you gave as section filter appears inside the given frame. "total" always appears, while "callExt" might not always appear for example | |||
|p3= frameSkip: [[Number]] (Optional, default 0) - number of frames to ignore before measuring | |||
|p3since= arma3 1.18 <!-- estimate, was committed at 2014-03-31 --> | |||
|p4= toFile: [[Boolean]] - (Optional, default [[false]]) if true, doesn't open UI and writes straight to file. If logging to file, it automatically also outputs a .trace file. Note: even if false it might still force to file if it doesn't have a UI, like a server or HC | |||
|p4since= arma3 2.20 | |||
|p5= continuousCounter: [[Number]] (Optional, default 0) - captures N slow frames. 0 or 1 will only capture one frame - don't set it to negative! Can be aborted by running diag_captureFrame or another captureSlowFrame | |||
|p5since= arma3 2.20 | |||
|r1= [[Nothing]] | |||
|x1= <sqf>diag_captureSlowFrame ["total", 0.003];</sqf> | |||
< | |x2= <sqf>diag_captureSlowFrame ["memAl", 0.0001, 30];</sqf> | ||
</ | |||
< | |x3= <sqf>diag_captureSlowFrame ["total", 0, 0, false, 3]; // Will open the capture UI three times</sqf> | ||
[[ | |seealso= [[Arma 3: Diagnostics Exe]] [[Performance Profiling]] [[Arma 3: Cheats]] [[Multiplayer_Server_Commands#Performance_Profiling|Admin chat commands]] [[diag_captureFrameToFile]] [[diag_captureFrame]] [[diag_logSlowFrame]] [[logEntities]] [[exportJIPMessages]] | ||
[[ | }} | ||
[[ | |||
[[ | |||
Latest revision as of 18:41, 24 November 2024
Description
- Description:
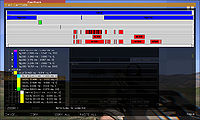
Opens "capture frame" dialog if current frame exceeds set threshold in seconds. One can indicate to either capture duration of a specific profiling selection or the total duration of the frame. The selection names can be obtained by expanding the profiling tree. Clicking on a tree item will highlight the item on the graph and vice versa. The GUI also provides method of copying of the displayed data to clipboard. Some of the selections:
Render Main Thread Visualize Mjob - bgD3D
- total
- memAl
- visul
- Mjob
- Groups:
- DiagnosticPerformance Profiling

Syntax
- Syntax:
- diag_captureSlowFrame [section, threshold, frameSkip, toFile, continuousCounter]
- Parameters:
- section: String - case-sensitive
- threshold: Number - section duration in seconds. 0 captures always IF the section you gave as section filter appears inside the given frame. "total" always appears, while "callExt" might not always appear for example
- since
 1.18
1.18 - frameSkip: Number (Optional, default 0) - number of frames to ignore before measuring
- since 2.20
- toFile: Boolean - (Optional, default false) if true, doesn't open UI and writes straight to file. If logging to file, it automatically also outputs a .trace file. Note: even if false it might still force to file if it doesn't have a UI, like a server or HC
- since 2.20
- continuousCounter: Number (Optional, default 0) - captures N slow frames. 0 or 1 will only capture one frame - don't set it to negative! Can be aborted by running diag_captureFrame or another captureSlowFrame
- Return Value:
- Nothing
Examples
- Example 1:
- diag_captureSlowFrame ["total", 0.003];
- Example 2:
- diag_captureSlowFrame ["memAl", 0.0001, 30];
- Example 3:
Additional Information
- See also:
- Arma 3: Diagnostics Exe Performance Profiling Arma 3: Cheats Admin chat commands diag_captureFrameToFile diag_captureFrame diag_logSlowFrame logEntities exportJIPMessages
Notes
-
Report bugs on the Feedback Tracker and/or discuss them on the Arma Discord or on the Forums.
Only post proven facts here! Add Note
Categories:
- Scripting Commands
- Introduced with Arma 2: Operation Arrowhead version 1.63
- Arma 2: Operation Arrowhead: New Scripting Commands
- Arma 2: Operation Arrowhead: Scripting Commands
- Arma 3: Scripting Commands: Diagnostic Branch
- Arma 3: Scripting Commands: Profiling Branch
- Take On Helicopters: Scripting Commands
- Arma 3: Scripting Commands
- Command Group: Diagnostic
- Command Group: Performance Profiling