Workbench Script Debugging – DayZ
Using the diagnostic version of the game executable (DayZDiax_x64.exe), it is possible to connect Workbench tool to a running instance of the game client/server and break and debug it's execution.
File Setup
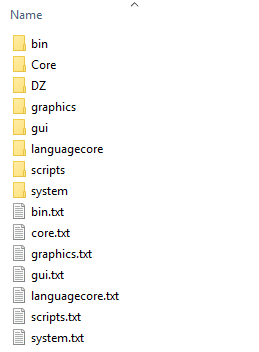
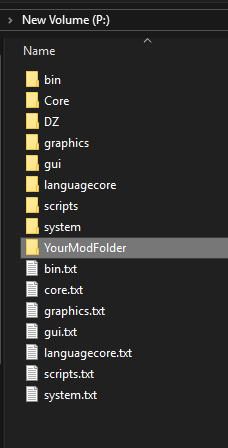
You will require official DayZ Tools where the Workbench tool is located and a way to unpack PBOs, using either the WorkDrive to unpack all the PBOs to your P:\ drive (recommended) or manually extract the script .pbo files (located inside your steam folder, by default C:\Program Files (x86)\Steam\steamapps\common\DayZ\dta\) using the BankRev tool.
P:\ drive with extracted PBOs
Note: For script debugging, only the script.pbo file needs to be extracted, containing the scripts\ folder. This will allow you to debug the running script. It is recommended to extract everything as Workbench has additional tools that can help you with modding.
Workbench Setup
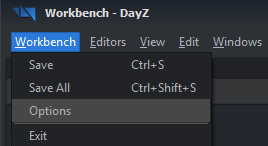
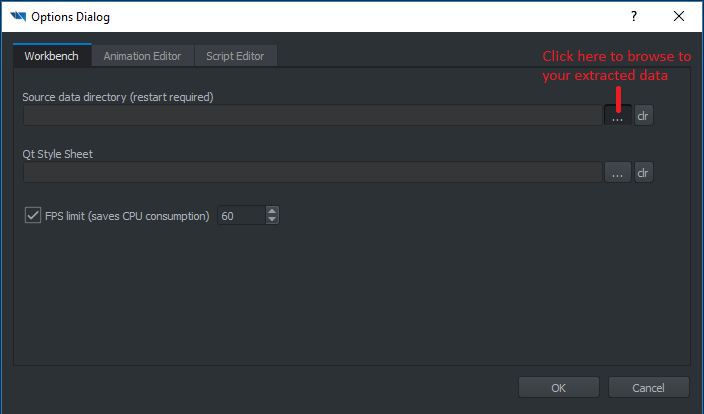
Launch the Workbench from Dayz Tools\Bin\Workbench\workbenchApp.exe or using the tool launcher. From the top menu, navigate to "Workbench → Options" and point the Source Data directory to where you have your data extracted, ideally just P:\
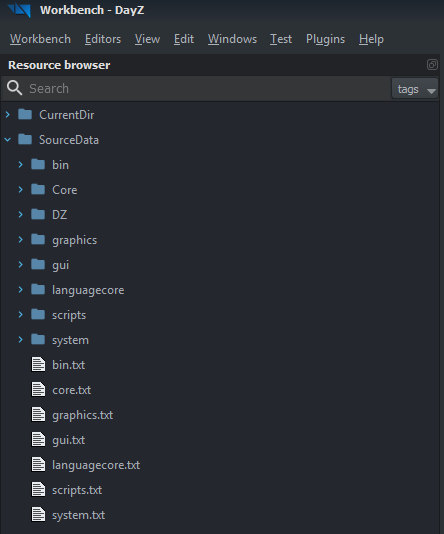
After confirming it will prompt for a restart (let it), after which you should be able to see the project structure in the Workbench Resource Browser just as they appear on your P:\ drive.
Connecting Workbench to DayZ
The DayZDiax_x64.exe is able to act as a client or as a server (with the addition of the -server command line parameter). It takes all the other parameters like the base executable.
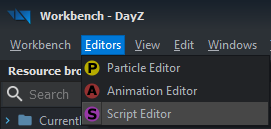
With workbench running, open the Script Editor module.
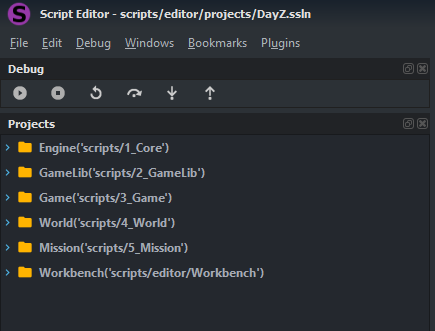
It has it's own Resource Browser but you can open .c files from the base Resource Browser by double clicking them, which automatically opens the Script Editor and loads the selected file.
When both the diagnostic executable and the Script Editor are running, it should automatically connect them, which will be announced by a brief popup window in the lower right part of your screen.
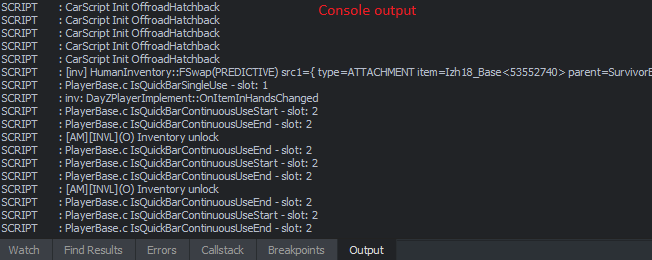
Now you will be able to see text Output that the diagnostic executable is printing for debug purposes and also debug your code by inserting breakpoints and step through the execution.
Note: If you only want to see the console output, then extracting and loading PBOs is not needed, Script Editor should connect to the diagnostic executable without them, but then only the console output is available.
Script Breakpoints
You can pause the script execution when it reaches a certain line in the script by inserting a Breakpoint - locate the line you are interested in and then by pressing F9 a red dot should appear to the left, indicating the execution will stop once it reaches that line. If a yellow exclamation mark in a red circle appears instead, it means that that line of code is never really executed and the script will not stop there.
When the script reaches the indicated line, it will pause it's execution and show you where by a yellow arrow.
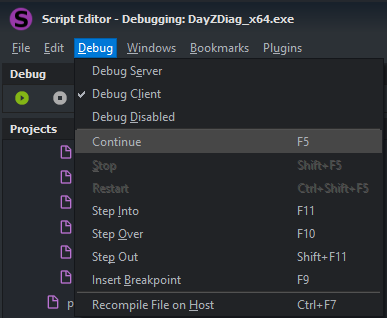
Basic controls and what you can do now are displayed in the top menu under Debug option. Here you also have to switch to the Debug Server option if you want to debug the script running on the server.
Note: You can also add and remove Breakpoints by left clicking where the red dots appear. Right clicking adds a blue Bookmark - these don't have any inherent function except marking script in interesting places so you can then easily navigate to them.
Debugging Modded Scripts
You need to load your modded scripts into Workbench if you want to debug them. Extracted mods have to include the mod.cpp config file for Workbench to automatically setup script module paths properly.
Place the mod folder in your P:\ drive and run workbenchApp.exe with
-mod=P:\@YourModFolder;P:\@YourOtherModFolder
Note: The @ symbol in a mod folder name is not a requirement
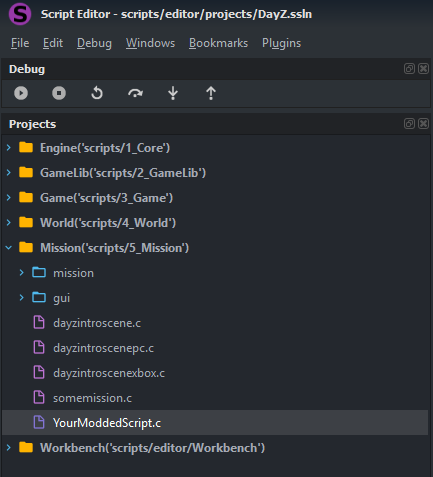
If done correctly, after opening the Script Editor you should see all your .c mod files in the Script Editor Resource Browser, in the root of the module that you are modding. So for example if you are modding the Mission module using class missionScriptModule in your mod.cpp then all your scripts should appear directly under Mission(scripts/5_Mission) in the Script Editor. You should also be able to find them using the search functions of the script editor.
You will also need to have your mod properly loaded in the game, which means having a packed or unpacked folder of the mod in your steam folder (by default C:\Program Files (x86)\Steam\steamapps\common\DayZ) and loading it with a startup parameter. In case of packed mods, launch DayZDiax_x64.exe with
-mod=@YourPackedModFolder
in case of unpacked mod, you will need both
-mod=@YourUnpackedModFolder and -filePatching
to allow use of unpacked data.
If you are debugging in a multiplayer environment (DayZDiax_x64.exe with -server launch parameter), you may need to have some of the following settings in serverDZ.cfg
allowFilePatching = 1;  // allow clients with unpacked data to join

BattlEye = 0; // turn off BE since diag exe does not run with it

verifySignatures = 0; // if testing mods which aren't properly signed
