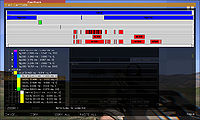
diag_captureSlowFrame
Jump to navigation
Jump to search
Description
- Description:
-
Opens "capture frame" dialog if current frame exceeds set threshold in seconds. One can indicate to either capture duration of a specific profiling selection or the total duration of the frame. The selection names can be obtained by expanding the profiling tree. Clicking on a tree item will highlight the item on the graph and vice versa. The GUI also provides method of copying of the displayed data to clipboard. Some of the selections:
Render Main Thread Visualize Mjob - bgD3D
- total
- memAl
- visul
- Mjob
- Groups:
- DiagnosticPerformance Profiling
Syntax
- Syntax:
- diag_captureSlowFrame [section, threshold, frameSkip, toFile, continuousCounter]
- Parameters:
- section: String - case-sensitive
- threshold: Number - section duration in seconds. 0 captures always IF the section you gave as section filter appears inside the given frame. "total" always appears, while "callExt" might not always appear for example.
Since 2.20 also accepts the threshold as String parameter with number plus s/ms/us/ns/fps suffix.
Note: The capture happens "when the section/scope duration is larger/longer than this", but with fps it is "when smaller/lower". - since
 1.18
1.18 - frameSkip: Number (Optional, default 0) - number of frames to ignore before measuring
- since
 2.20
2.20 - toFile: Boolean - (Optional, default false) if true, doesn't open UI and writes straight to file. If logging to file, it automatically also outputs a .trace file. Note: even if false it might still force to file if it doesn't have a UI, like a server or HC
- since
 2.20
2.20 - continuousCounter: Number (Optional, default 0) - captures N slow frames. 0 or 1 will only capture one frame - don't set it to negative! Can be aborted by running diag_captureFrame or another captureSlowFrame
- Return Value:
- Nothing
Examples
- Example 1:
- diag_captureSlowFrame ["total", 0.003];
- Example 2:
- diag_captureSlowFrame ["total", "0.003s"];
- Example 3:
- diag_captureSlowFrame ["total", "3ms"];
- Example 4:
- diag_captureSlowFrame ["total", "333fps"];
- Example 5:
- diag_captureSlowFrame ["memAl", 0.0001, 30];
- Example 6:
Additional Information
- See also:
- Arma 3: Diagnostics Exe Performance Profiling Arma 3: Cheats Admin chat commands diag_captureFrameToFile diag_captureFrame diag_logSlowFrame logEntities exportJIPMessages
Notes
-
Report bugs on the Feedback Tracker and/or discuss them on the Arma Discord or on the Forums.
Only post proven facts here! Add Note
Categories:
- Scripting Commands
- Introduced with Arma 2: Operation Arrowhead version 1.63
- Arma 2: Operation Arrowhead: New Scripting Commands
- Arma 2: Operation Arrowhead: Scripting Commands
- Arma 3: Scripting Commands: Diagnostic Branch
- Arma 3: Scripting Commands: Profiling Branch
- Take On Helicopters: Scripting Commands
- Arma 3: Scripting Commands
- Command Group: Diagnostic
- Command Group: Performance Profiling
