Performance Profiling
Jump to navigation
Jump to search
Versions with performance profiling
- 98699
- 98711
- 98809
These beta builds contain performance tools normally not available for a retail version. These builds will be a bit slower as a result, and is therefore not intended for a general use.
Scripting commands
How to use
- Run a mission
- Execute a scripted command diag_captureSlowFrame ['total',0.3] using any means (DevCon, mission radio trigger...)
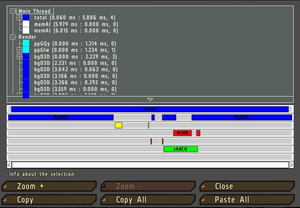
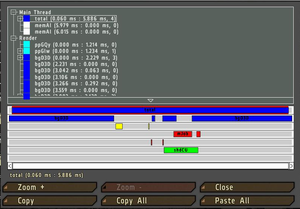
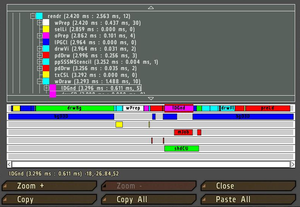
- Once a slow frame is detected, a window will open.
- In the window you will be able to browse a lot of interesting performance information, which can be interesting.
- But the main thing you should do so that I can see the information as well is:
- Select Main Thread (if not selected yet)
- Press Copy button
- Open an external text editor
- Paste the text into a new file
- Save the file
Notes
- 0.3 is a time in second used to determine what duration of a frame you consider abnormal, and first such frame will be captured.
- 0.3 is definitely something you should not see in a normal game.
- If you do not capture any frames with 0.3, try lowering it to 0.2 or 0.1.
- If it triggers too early, before the main slowdown happens, increase it to a higher value, e.g. 1.0.


