Diag Menu – DayZ
The Diag Menu is a menu listing many options used to debug game scripting and assets. It is available in the diagnostic version of the game executable (DayZDiag_x64.exe).
- Statistics
- Enfusion render
- Enfusion world
- DayZ render
- Game
- AI
- Sounds
Statistics
- FPS Ctrl + NUM 1
- Script profiler UI
- > Script profiler settings
- Always enabled
- Flags
- Module
- Update interval
- Average
- Time resolution
- (UI) Scale
FPS
Enables the showing of FPS in the top left corner of the screen.
Script profiler UI
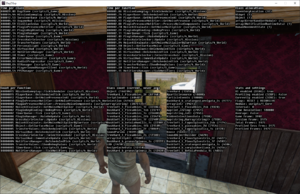
Turns on the on-screen Script Profiler.
| Section | Info | ||||||||||||||||||||||||||||||||||||||||||
|---|---|---|---|---|---|---|---|---|---|---|---|---|---|---|---|---|---|---|---|---|---|---|---|---|---|---|---|---|---|---|---|---|---|---|---|---|---|---|---|---|---|---|---|
| Time per class | The total time of all function calls belonging to this class.
Shows the top 20 times. | ||||||||||||||||||||||||||||||||||||||||||
| Time per function | The total time of all calls to a function.
Shows the top 20 times. | ||||||||||||||||||||||||||||||||||||||||||
| Class allocations | The amount of allocations of a class.
Shows the top 20 allocations. | ||||||||||||||||||||||||||||||||||||||||||
| Count per function | The amount of times a function was called.
Shows the top 20 counts. | ||||||||||||||||||||||||||||||||||||||||||
| Class count | The amount of instances of a class.
Shows the top 40 counts. | ||||||||||||||||||||||||||||||||||||||||||
| Stats and settings |
|
Script Profiler UI
A set of settings to tweak the gathering of script profiling data.
Always Enabled
Gathering of script profiling data is not enabled by default, this bool displays whether it is currently enabled or not. If it is desired that the script profiler is enabled at start, the launch parameter "-profile" can be used to achieve this.
Flags
The set of flags that define how data is gathered.
| Available options | Info |
|---|---|
| SPF_RECURSIVE | Data is gathered from the currently selected module and its children
Data is per frame |
| SPF_RECURSIVE | Data is gathered from the currently selected module and its children
Data is accumulated across frames |
| SPF_RESET | Data is only gathered from the currently selected module
Data is per frame |
| SPF_NONE | Data is only gathered from the currently selected module
Data is accumulated across frames |
The meaning of flags:
- SPF_RECURSIVE: Enables profiling of child modules (recursively goes through them)
- SPF_RESET: Enables the clearing of data at the end of the frame (resets the data)
Module
The module to be profiled.
| Available options | Info |
|---|---|
| CORE | 1_Core |
| GAMELIB | 2_GameLib |
| GAME | 3_Game |
| WORLD | 4_World |
| MISSION | 5_Mission |
| MISSION_CUSTOM | init.c |
Update Interval
The amount of frames to wait before updating the sorted data. This also delays the reset caused by SPF_RESET.
Average
Enable/disable the displaying and returning of averages. Of course, when the SPF_RESET flag is present and there is no interval, this will be the value itself.
When SPF_RESET flag is not present, it will divide by the session frame. When an interval is set, it will divide by the interval.
Class count will never be an average, it will always be the current count of the instance, allocations will be the average value of how many times an instance was created.
Time resolution
Set the time resolution to display time in. This is in the form of nth of a second.
So that means that 1 means in seconds and 1000 means in milliseconds.
(UI) scale
Sets the scale of the on-screen script profiler UI. Simply because there are different screens and resolutions, and this way you can tweak it to be better visible if necessary.
There is no EnProfiler API equivalent for this, as it is purely for the on-screen UI.
Enfusion Renderer
- Lights
- > Lighting
- Ambient lighting
- Ground lighting
- Directional lighting
- Bidirectional lighting
- Specular lighting
- Reflection
- Emission lighting
- Shadows
- Terrain shadows
- Render debug mode RCtrl + AltGr + W
- Occluders
- Occlude entities
- Occlude proxies
- Show occluder volumes
- Show active occluders
- Show occluded
- Widgets
- Postprocess Ctrl + LAlt + P
- Terrain
- > Materials
- Common
- TreeTrunk
- TreeCrown
- Grass
- Basic
- Normal
- Super
- Skin
- Multi
- Old Terrain
- Old Roads
- Water
- Sky
- Sky clouds
- Sky stars
- Sky flares
- Particle Sprite
- Particle Streak
Lights
Enable/disable lights. This only affects actual light sources such as the PersonalLight or in-game items, not the environment lights. For the environmental lighting, there is the following submenu.
Lighting
The following toggles toggle the respective lighting.
Ambient lighting
Toggles the general ambient lighting.
Ground lighting
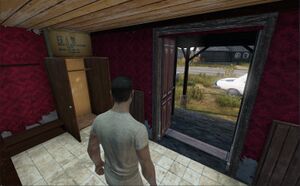
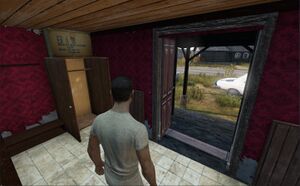
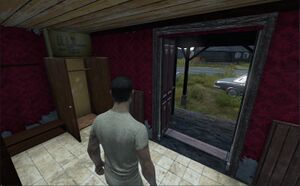
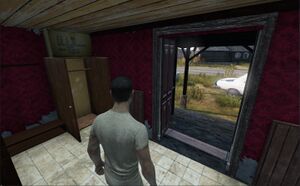
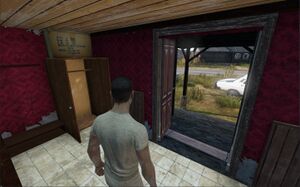
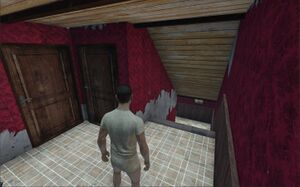
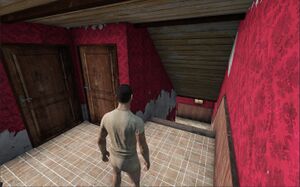
Toggles the lighting reflected from the ground. Noticeable difference is on the roof and the character's underarms.
Directional lighting
Toggles the general directional lighting of the world. Without this, the bidirectional lighting is actually also turned off, as it depends on this.
Bidirectional lighting
Toggles the general bidirectional lighting of the world.
Specular lighting
Toggles the specular lighting. Noticeable differences are on the side of the cupboard and on the car.
Reflection
Toggles the reflection lighting. Noticeable differences are on the side of the cupboard and on the car.
Emission lighting
Toggles the emission lighting.
Shadows
Enables/disables shadows. Additionally, this also disables the culling of rain inside of objects.
Terrain shadows
Changes the setting for how terrain shadows are generated.
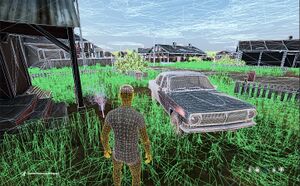
Render debug mode
Special render settings to see how the mesh wireframe looks like in game.
Different materials have a different wire colour.
| Material | Color (RGB) |
|---|---|
| TreeTrunk | 179, 126, 55 |
| TreeCrown | 143, 227, 94 |
| Grass | 41, 194, 53 |
| Grass Material | 61, 194, 83 |
| Basic | 208, 87, 87 |
| Normal | 204, 66, 107 |
| Super | 234, 181, 181 |
| Super Ext | 234, 181, 0 |
| Skin | 252, 170, 18 |
| Multi | 143, 185, 248 |
| Terrain | 255, 127, 127 |
| Old Terrain | 122, 148, 129 |
| Old Terrain Simple | 96, 128, 105 |
| Old Roads | 173, 188, 177 |
| Old Sprite | 242, 247, 210 |
| Water | 51, 51, 255 |
| Ocean | 51, 128, 255 |
| Ocean Shore | 30, 193, 177 |
| Sky | 143, 185, 248 |
| Sky clouds | 193, 247, 253 |
| Sky stars | 255, 255, 255 |
| Sky flares | 201, 206, 245 |
| Particle sprite | 128, 128, 255 |
| Particle streak | 255, 128, 128 |
Occluders
Enable/disable the occluding of objects. This is more visible when paired with for example Show occluded.
Occlude entities
Enable/disable the occluding of entities.
Occlude proxies
Enable/disable the occluding of proxies.
Show occluder volumes
When enabled, takes a snapshot of the moment and draws debug shapes visualizing the occluding. Disabling it clears the debug shapes.
Show active occluders
When enabled, shows the currently active occluders by visualizing them with debug shapes.
Show occluded
Visualizes the occluded objects by using debug shapes.
Widgets
Enable/disable the rendering of widgets.
Postprocess
Enable/disable the rendering of post process effects.
Terrain
Enable/disable the rendering of terrain.
Materials
Enable/disable the rendering of specific materials. Most are self-explanatory.
Common
TreeTrunk
TreeCrown
Grass
Basic
Normal
Super
This is an overarching one which contains every material related to super.
Skin
Multi
Old Terrain
This is both Terrain and Terrain Simple.
Old Roads
Water
This is an overarching one which contains every material related to water.
Sky
Sky clouds
Sky stars
Sky flares
Particle Sprite
Particle Streak
Enfusion World
- Show Bullet
- > Bullet
- Draw Char Ctrl
- Draw Simple Char Ctrl
- Max. Collider Distance
- Draw Bullet shape
- Draw Bullet wireframe
- Draw Bullet shape AABB
- Draw obj center of mass
- Draw Bullet contacts
- Force sleep Bullet
- Show stats
- Show bodies LAlt + NUM 6
Show Bullet
Turns on the debug visualization of Bullet.
Bullet
Settings to tweak the debug visualization of Bullet.
Draw Char Ctrl
Enable/disable the visualizations for the character controller used by the player. Depends on Draw Bullet shape.
Draw Simple Char Ctrl
Enable/disable the visualizations for the character controller used by AI. Depends on Draw Bullet shape.
Max. Collider Distance
The maximum distance between an object and the player to visualize the collider. Depends on Draw Bullet shape.
Draw Bullet shape
Enable/disable the visualizations of bullet colliders.
Draw Bullet wireframe
Enable/disable the visualizations of bullet colliders to be only wireframe. Depends on Draw Bullet shape.
Draw Bullet shape AABB
Enable/disable the visualizations of axis aligned bounding box of colliders.
Draw obj center of mass
Enable/disable the visualizations of objects center of mass.
Draw Bullet contacts
Enable/disable the visualizations of colliders making contact.
Force sleep Bullet
Enable/disable force sleeping all bodies.
Show stats
Enable/disable showing debug stats. When disabling, the last shown stats will be shown for 10 more seconds before disappearing.
Show bodies
Enable/disable the visualizations of Bullet bodies.
DayZ render
- Geometry diagnostic
- disgnostic mode
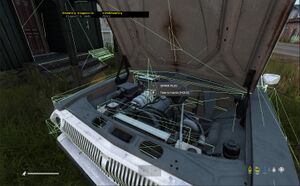
Geometry diagnostic
Enable the drawing of debug shapes, displaying how the selected geometry of an object looks like in-game.
diagnostic mode
Drawing properties for the Geometry diagnostic.
Game
- > Weather&environment
- Display
- Force fog at camera
- Override fog
- Distance density
- Height density
- Distance offset
- Height bias
- Free Camera
- FrCam Player Move Page Up
- FrCam NoClip
- FrCam Freeze Page Down
- > Vehicles
- Audio
- Simulation
- > Combat
- DECombat
- DEShots
- DEHitpoints
- DEExplosions
- > Legacy/obsolete
- DEAmbient
- DELight
- DESurfaceSound
- > Central Economy
- > Loot Spawn Edit
- Spawn Volume Vis
- Setup Vis
- Edit Volume
- Re-Trace Group Points
- Spawn Candy
- Spawn Rotation Test
- Placement Test
- Export Group >>
- Export All Groups >>>>
- <<< Export Map
- <<< Export Clusters
- Export Economy [csv]
- Export Respawn Queue [csv]
- > Loot Tool
- Deplete Lifetime
- Set Damage = 1.0
- Damage + Deplete
- Invert Avoidance
- Project Target Loot
- > Infected
- Infected Vis
- Infected Zone Info
- Infected Spawn
- Reset Cleanup
- > Animal
- Animal Vis
- Animal Spawn
- Ambient Spawn
- > Building
- Building Stats
- Vehicle&Wreck Vis
- Loot Vis
- Cluster Vis
- Dynamic Events Status
- Dynamic Events Vis
- Dynamic Events Spawn
- Export Dyn Event >>
- Overall Stats
- Updaters State
- Idle Mode
- Force Save
- > Loot Spawn Edit
Weather&environment
Display
Force fog at camera
Override fog
Distance density
Height density
Distance offset
Height bias
Free Camera
FrCam Player Move
FrCam NoClip
FrCam Freeze
Vehicles
Audio
Simulation
Combat
DECombat
DEShots
DEHitpoints
DEExplosions
Legacy/obsolete
DEAmbient
DELight
DESurfaceSound
Central Economy
Loot Spawn Edit
Spawn Volume Vis
Setup Vis
Edit Volume
Re-Trace Group Points
Spawn Candy
Spawn Rotation Test
Placement Test
Export Group
Export All Groups
Export Map
Export Clusters
Export Economy [csv]
Export Respawn Queue [csv]
Loot Tool
Deplete Lifetime
Set Damage = 1.0
Damage + Deplete
Invert Avoidance
Project Target Loot
Infected
Infected Vis
Infected Zone Info
Infected Spawn
Reset Cleanup
Animal
Animal Vis
Animal Spawn
Ambient Spawn
Building
Building Stats
Vehicle&Wreck Vis
Loot Vis
Cluster Vis
Dynamic Events Status
Dynamic Events Vis
Dynamic Events Spawn
Export Dyn Event
Overall Stats
Updaters State
Idle Mode
Force Save
AI
- Show NavMesh
- Debug Pathgraph World
- Debug Path Agent
- Debug AI Agent
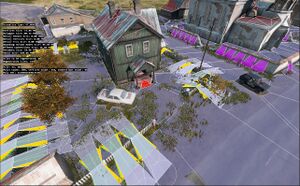
Draws debug shapes to visualize the navigation mesh. Additionally shows an on-screen debug with stats.
| Key bind | Functionality |
|---|---|
| NUM 0 | Register "Test start" at camera position |
| NUM 1 | Regenerate tile at camera position |
| NUM 2 | Regenerate tiles around camera position |
| NUM 3 | Iterate forwards through visualization types |
| LAlt + NUM 3 | Iterate backwards through visualization types |
| NUM 4 | Register "Test end" at camera position
Will draw a wireframe sphere at "Test start" and "Test end" and a line between them If a path was successfully found, they will be green, otherwise red When no "Test start" was selected through NUM0, "Test start" will be <0, 0, 0> |
| NUM 5 | NavMesh nearest position test (SamplePosition)
Will draw a blue wireframe sphere at camera position and pink wireframe sphere at result |
| NUM 6 | NavMesh raycast test
Will draw a blue wireframe sphere at camera position and pink wireframe sphere at result |
Debug Pathgraph World
On-screen debug showing of many Path Job Requests have been completed and how many there are currently.
Debug Path Agent
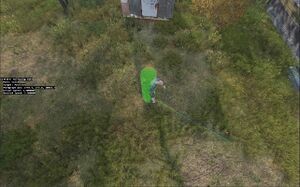
Turns on on-screen debug and debug shapes regarding a "Path Agent" (AI).
This one is for when only interested in their pathing.
Target an AI to select it for tracking.
Debug AI Agent
Turns on on-screen debug and debug shapes regarding an AI.
This one is more for the alertness and behaviour of an AI.
Target an AI to select it for tracking.
Sounds
- Show playing samples
- Show system info
Show playing samples
Debug for debugging playing sounds.
| Option | Info |
|---|---|
| none | Default: no debug |
| ImGui | Separate screen debug made with dear ImGui, newest iteration, created to have all pros of the other two while fixing the cons.
The settings of the separate window will be stored in profiles under the names "playing_sounds_imgui.ini" and "playing_sounds_imgui.bin" |
| DbgUI | Legacy
|
| Engine | Legacy
|
Show system info
Shows on-screen debug stats of the sound system. Used to be paired with "Show playing samples" DbgUI option, is also visible in the other two "Show playing samples" options.


