diag captureSlowFrame: Difference between revisions
Jump to navigation
Jump to search
m (template:command argument fix) |
Lou Montana (talk | contribs) m (Some wiki formatting) |
||
| (29 intermediate revisions by 2 users not shown) | |||
| Line 1: | Line 1: | ||
{{ | {{RV|type=command | ||
| arma2oa |= | |game1= arma2oa | ||
|version1= 1.63 | |||
|1. | |game2= tkoh | ||
|version2= 1.00 | |||
| | |game3= arma3 | ||
|version3= 1.00 | |||
|branch= diag prof | |||
| | |gr1= Diagnostic | ||
| | |gr2= Performance Profiling | ||
| | |descr= [[File:CaptureSlowFrame.jpg|right|200x120px]] | ||
Opens "capture frame" dialog if current frame exceeds set threshold in seconds. One can indicate to either capture duration of a specific profiling selection or the total duration of the frame. The selection names can be obtained by expanding the profiling tree. Clicking on a tree item will highlight the item on the graph and vice versa. The GUI also provides method of copying of the displayed data to clipboard. Some of the selections: | |||
{{{!}} class="wikitable valign-top-row-2" style="margin: 1em auto" | |||
! Render | |||
! Main Thread | |||
! Visualize | |||
! Mjob | |||
{{!}}- | |||
{{!}} | |||
* bgD3D | |||
{{!}} | |||
* total | |||
* memAl | |||
{{!}} | |||
* visul | |||
{{!}} | |||
* Mjob | |||
{{!}}} | |||
| | |s1= [[diag_captureSlowFrame]] [section, threshold] | ||
| [[ | |p1= section: [[String]] - case sensitive | ||
|p2= threshold: [[Number]] - section duration in seconds | |||
|r1= [[Nothing]] | |||
|x1= <sqf>diag_captureSlowFrame ["total", 0.003];</sqf> | |||
</ | |||
< | |x2= <sqf>diag_captureSlowFrame ["memAl", 0.0001];</sqf> | ||
[[ | |seealso= [[Performance Profiling]] [[diag_captureFrame]] [[diag_logSlowFrame]] | ||
[[ | }} | ||
[[ | |||
Latest revision as of 17:30, 16 December 2022
Description
- Description:
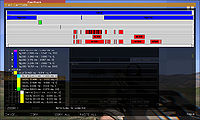
Opens "capture frame" dialog if current frame exceeds set threshold in seconds. One can indicate to either capture duration of a specific profiling selection or the total duration of the frame. The selection names can be obtained by expanding the profiling tree. Clicking on a tree item will highlight the item on the graph and vice versa. The GUI also provides method of copying of the displayed data to clipboard. Some of the selections:
Render Main Thread Visualize Mjob - bgD3D
- total
- memAl
- visul
- Mjob
- Groups:
- DiagnosticPerformance Profiling

Syntax
- Syntax:
- diag_captureSlowFrame [section, threshold]
- Parameters:
- section: String - case sensitive
- threshold: Number - section duration in seconds
- Return Value:
- Nothing
Examples
- Example 1:
- diag_captureSlowFrame ["total", 0.003];
- Example 2:
- diag_captureSlowFrame ["memAl", 0.0001];
Additional Information
Notes
-
Report bugs on the Feedback Tracker and/or discuss them on the Arma Discord or on the Forums.
Only post proven facts here! Add Note
Categories:
- Scripting Commands
- Introduced with Arma 2: Operation Arrowhead version 1.63
- Arma 2: Operation Arrowhead: New Scripting Commands
- Arma 2: Operation Arrowhead: Scripting Commands
- Arma 3: Scripting Commands: Diagnostic Branch
- Arma 3: Scripting Commands: Profiling Branch
- Take On Helicopters: Scripting Commands
- Arma 3: Scripting Commands
- Command Group: Diagnostic
- Command Group: Performance Profiling