Performance Profiling: Difference between revisions
(note about diag_captureSlowFrame as alternative to diag_logSlowFrame since A3 2.20) |
(added fps basics section with table) |
||
| Line 20: | Line 20: | ||
* [[diag_logSlowFrame]] - not available in Arma 3. Since {{GVI|arma3|2.20}} [[diag_captureSlowFrame]] with '''toFile''' parameter can log to file as alternative. | * [[diag_logSlowFrame]] - not available in Arma 3. Since {{GVI|arma3|2.20}} [[diag_captureSlowFrame]] with '''toFile''' parameter can log to file as alternative. | ||
* [[diag_captureFrameToFile]] | * [[diag_captureFrameToFile]] | ||
== FPS basics == | |||
The duration the engine needs to compute all calculations in one cycle is called a frame. The frame-rate in return states how many cycles the engine could compute per second. | |||
{{Feature|important| | |||
The shorter a cycle/frame, the higher the fps. | |||
}} | |||
{{Feature|informative| | |||
Note: One second consists of one thousand [https://en.wikipedia.org/wiki/Millisecond milliseconds]. 1 s <nowiki>=</nowiki> 1000 ms | |||
}} | |||
{| class="wikitable" | |||
|+ FPS to frame duration table | |||
|- | |||
! FPS !! seconds !! milliseconds | |||
|- | |||
| 100 || 0.010 || 10 | |||
|- | |||
| 60 || 0.017 || 17 | |||
|- | |||
| 50 || 0.020 || 20 | |||
|- | |||
| 40 || 0.025 || 25 | |||
|- | |||
| 30 || 0.033 || 33 | |||
|- | |||
| 20 || 0.050 || 50 | |||
|- | |||
| 10 || 0.100 || 100 | |||
|- | |||
| 5 || 0.200 || 200 | |||
|- | |||
| 4 || 0.250 || 250 | |||
|- | |||
| 3 || 0.333 || 333 | |||
|- | |||
| 2 || 0.500 || 500 | |||
|- | |||
| 1 || 1.0 || 1000 | |||
|} | |||
Revision as of 15:22, 16 November 2024
Versions with performance profiling
The Profiling build is provided by Dwarden in tandem with Arma 3 Performance build. It can be found in the BI Forums as well as in the #perf_prof_branch channel in the official Arma 3 Discord server.
Scripting Commands
- diag_captureFrame
- diag_captureSlowFrame
- diag_logSlowFrame - not available in Arma 3. Since
 2.20 diag_captureSlowFrame with toFile parameter can log to file as alternative.
 - diag_captureFrameToFile
FPS basics
The duration the engine needs to compute all calculations in one cycle is called a frame. The frame-rate in return states how many cycles the engine could compute per second.
| FPS | seconds | milliseconds |
|---|---|---|
| 100 | 0.010 | 10 |
| 60 | 0.017 | 17 |
| 50 | 0.020 | 20 |
| 40 | 0.025 | 25 |
| 30 | 0.033 | 33 |
| 20 | 0.050 | 50 |
| 10 | 0.100 | 100 |
| 5 | 0.200 | 200 |
| 4 | 0.250 | 250 |
| 3 | 0.333 | 333 |
| 2 | 0.500 | 500 |
| 1 | 1.0 | 1000 |
How to Use
- Run a mission
- Execute a scripted command diag_captureSlowFrame ["total", 0.3]; using any means (Debug Console, mission radio trigger...)
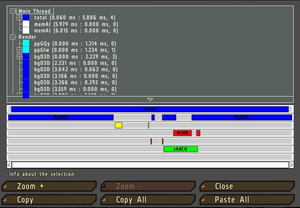
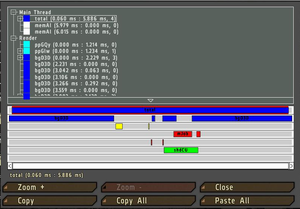
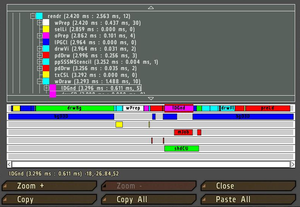
- Once a slow frame is detected, a window will open
- In the window you will be able to browse a lot of performance-related data, which can be interesting
- To export the gathered information for sharing with others:
- Select Main Thread (if not selected yet)
- Press the Copy button
- Open an external text editor
- Paste the text into a new file
- Save the file
Creating Your Own Subtree
When Profiling Per-Frame Eventhandlers (PFH), diag_captureFrame only shows one blob called siFEH that contains all PFH's so you can't see what part of that is caused by your PFH.
You can create your own subtree inside siFEH by wrapping your function call inside a isNil CODE statement like this:
Turn your old call which may look like this:
Into something like this:
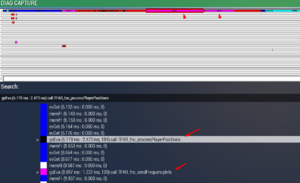
Now when you run diag_captureFrame inside of siPFH you will have a subtree called gsEva and behind that you can see the first line of code inside the isNil statement.
It will only show a part of the first line of that code so you should put something descriptive into the isNil statement.
You can use the same to create a subtree for any function you like. This will also work inside Scheduled (spawned) scripts.
But using this method to "subtree" a function with return values requires a little bit of trickery to get the return value out.
Notes
- 0.3 is a time in second used to determine what duration of a frame you consider abnormal, and first such frame will be captured.
- 0.3 is definitely something you should not see in a normal game.
- If you do not capture any frames with 0.3, try lowering it to 0.2 or 0.1.
- If it triggers too early, before the main slowdown happens, increase it to a higher value, e.g. 1.0.


