Performance Profiling
Versions with performance profiling
The Profiling build is provided in semi regular intervals between major game version updates by Dedmen in tandem with Arma 3 Performance build.
The download and changelog can be found in the BI Forums as well as in the #perf_prof_branch channel in the official Arma 3 Discord server.
How to set up
Steam branch
AUTOMATIC (Recommended) - see also Steam Branches.
- Open Steam
- Right click on Arma 3 in your Steam Library, then Properties
- Select the tab betas
- Finally, use the dropdown list to select the branch profiling - Performance Profiling Build
- Wait for the download to finish
This will automatically download newest performance exe once they are available.
Google Drive
MANUAL (only when needed)
- Download and install 7z (usually the 64-bit Windows x64 variant)
- Open BI forum thread
- Got to latest post with a link to google drive
- Browse to the latest game version and profiling build version folder
- Download the desired exe from the google drive folder (usually the arma3client_x64_profiling_XXX.7z)
- Extract the 7z file and copy the exe to your game folder (usually C:
\Program Files (x86) \Steam \steamapps \common \Arma 3)
FPS basics
The duration the engine needs to compute all calculations in one cycle is called a frame. The frame-rate, or frames-per-second (fps), in return states how many cycles the engine could compute per second.
| FPS | seconds | milliseconds |
|---|---|---|
| 100 | 0.010 | 10 |
| 60 | 0.017 | 17 |
| 50 | 0.020 | 20 |
| 40 | 0.025 | 25 |
| 30 | 0.033 | 33 |
| 20 | 0.050 | 50 |
| 10 | 0.100 | 100 |
| 5 | 0.200 | 200 |
| 4 | 0.250 | 250 |
| 3 | 0.333 | 333 |
| 2 | 0.500 | 500 |
| 1 | 1.0 | 1000 |
Duration parameter
- The duration parameter is a time measured in seconds. 0.3 (seconds) is the same as 300 ms / milliseconds.
- It is used to determine what duration of a frame you consider abnormal or that you are interested in for other reasons.
- The first time such frame happens, the frame information will be captured - or put differently: when a situation occurs with a frame lasting longer than said duration.
- 0.3 (<3 fps for the whole frame) is definitely something you should not see in a normal game.
- If you do not capture any frames with 0.3, try lowering it to 0.2 (200 ms / <5 fps) or 0.1 (100 ms / <10 fps).
- If it triggers "too early" before the main slowdown happens that you want to analyze, increase it to a higher value, e.g. 1.0 for long freeze (<1 fps).
Scope parameter
- total is name for the scope of the duration for the whole frame (sLoop on a dedicated server).
- With the total scope you capture more or less your frames per second (fps) - if your current frame-rate is essentially stable. In other words if all frames for that second have roughly similar duration.
- In some situations you may encounter single/few frame lasting mini-freezes - aka one/few frames take rather long to complete (ie 100 ms), yet the rest remains in your normal fps range (20 ms for 50 fps for example).
- Whereas a longer freeze means usually a frame last very long, like a second or longer. Thus the game stalls altogether for the given timeframe.
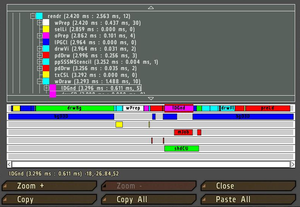
- The scope parameter now allows you to capture subparts of a frame, of different parts of the engine computation - in general terms like networking, world and unit simulation, AI behavior, sound, rendering and visibility checks.
- The total scope is also the mainframe - all things the engine has to complete in a cycle. In addition there are other threads, where the engine moves other tasks to be computed alongside. Essentially this is what multi-threading is about, allowing the CPU with multiple cores to compute more things at the same time, and thus to reduce the duration of the main frame.
- With the scope parameter you can said subparts from the mainframe, yet also from the so called "worker" threads.
- The names for scopes/subscopes you can get from the capture frame UI or in the frame capture logging files (.log/.trace).
How to capture
Client
- Run a mission
- Execute a scripted command diag_captureSlowFrame ["total", 0.3];// [scope, duration] using any means (Debug Console, mission radio trigger...)
- Once a slow frame is detected, a window will open
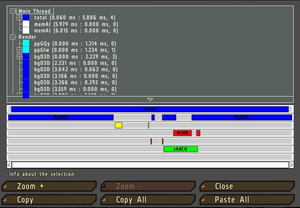
- In the window you will be able to browse a lot of performance-related data, which can be interesting
- To export the gathered information for sharing with others:
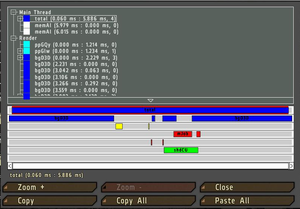
- Select Main Thread (if not selected yet)
- Press the Copy button
- Open an external text editor
- Paste the text into a new file
- Save the file
Server
How to view a capture
Ingame
Externally
Scripting Commands
- diag_captureFrame
- diag_captureSlowFrame
- diag_logSlowFrame - not available in Arma 3. Since
 2.20 diag_captureSlowFrame with toFile parameter can log to file as alternative.
 - diag_captureFrameToFile
Creating Your Own Subtree
When Profiling Per-Frame Eventhandlers (PFH), diag_captureFrame only shows one blob called siFEH that contains all PFH's so you can't see what part of that is caused by your PFH.
You can create your own subtree inside siFEH by wrapping your function call inside a isNil CODE statement like this:
Turn your old call which may look like this:
Into something like this:
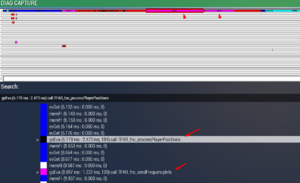
Now when you run diag_captureFrame inside of siPFH you will have a subtree called gsEva and behind that you can see the first line of code inside the isNil statement.
It will only show a part of the first line of that code so you should put something descriptive into the isNil statement.
You can use the same to create a subtree for any function you like. This will also work inside Scheduled (spawned) scripts.
But using this method to "subtree" a function with return values requires a little bit of trickery to get the return value out.


