Script Editor – Arma Reforger
Welcome to the Enfusion Script Editor!
The Script Editor is a text editor module with integrated debugger, available from within the Enfusion Workbench that allows the user to edit, manage and debug scripts. It also provides many tools and utilities for improved efficiency like syntax highlighting, script auto-completion, fast script validation and numerous different methods of searching files, scripts and symbols within the project.
For a Script Editor newcomer's quickstart see the Getting Started section.
To learn more about the features of the Script Editor, see Script Editor Features.
Script Editor Features
The Script Editor provides many features that make writing and managing code easier.
There are numerous ways of searching through the code, namely Find File, Text Search or Find Symbol in addition to the Outline, Find In Entire Solution and Goto Declaration functionalities.
To learn more about navigating the Script Editor and the codebase, see Navigate and find code. To learn more about script syntax error checking and validation, see Compilation and Errors.
Run-time Debugging features include - but are not limited to - the Debugger, Breakpoints, Callstack and Watch. For more information regarding debugging, see Debugging.
Editor Features
| Feature | Description |
|---|---|
| Syntax Highlighting | Highlighting of language specific keywords, functions and matching braces. |
| Auto Complete | Auto-completion/suggestion of code via known symbols. See Auto Complete. |
| Script Validation and Error Checking | Syntax checking, for more information see Compilation and Errors. |
| Searching | Full-text search, symbol search, search for files and more. See Searching. |
| Line Numbers | Script file line numbers display in the Text Editor. |
| Debugger | Code can be debugged step by step via the usage of the debugger. See Debugging. |
| Undo and Redo | Changes made by the user can be undone and redone at will. |
Moving around in the code can be done in several different ways, including navigating backwards and forwards to the last insertion points. Navigation can also be done via Goto Declaration.
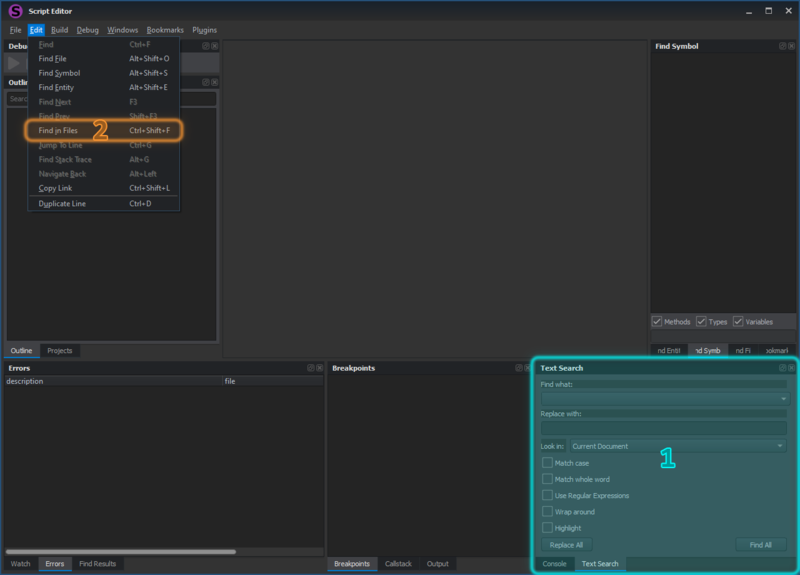
Search for and replace text in single or multiple files can be done using the Find in Files.
Editor Personalization
The layout of the Script Editor is composed from many different windows and panels. They can be resizes, undocked from their position or docked to a preference. To learn more refer to Script Editor Windows. In addition, the Script Editor can also be customised to a certain degree by changing the font and font size it uses by default - find more information in Preferences.
Editor Shortcuts
Opposed to finding particular options from within the Editor windows manually, there is also the option to use some of (or all of) the available keyboard shortcuts - learning to use them might drastically improve the speed and efficiency of the workflow. For more information about keyboard shortcuts, see Keyboard Shortcuts.
Getting Started
In this quick introduction to the Script Editor we'll take a tour of some of the windows, tools and other features. For a more in-depth look at features of the Script Editor see Script Editor Features.
Opening Workbench
The Script Editor can be opened from the main Enfusion Workbench window at any time. There can only be one instance of the Script Editor running, but it can be opened and closed at free will.
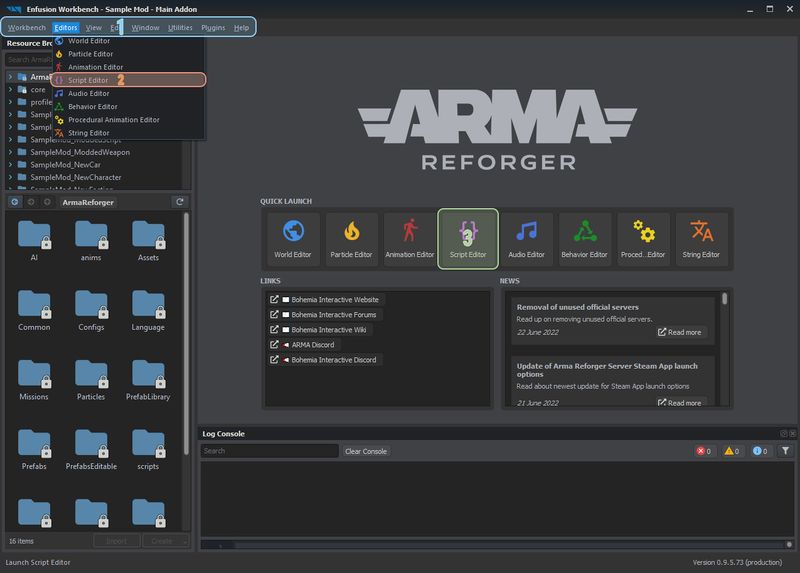
The Script Editor can be opened from the Workbench menu bar (1) by selecting the Script Editor (2) option in the Editors drop-down menu, or by clicking the Script Editor button (3) in the Resource Manager's welcome page.
Default Layout
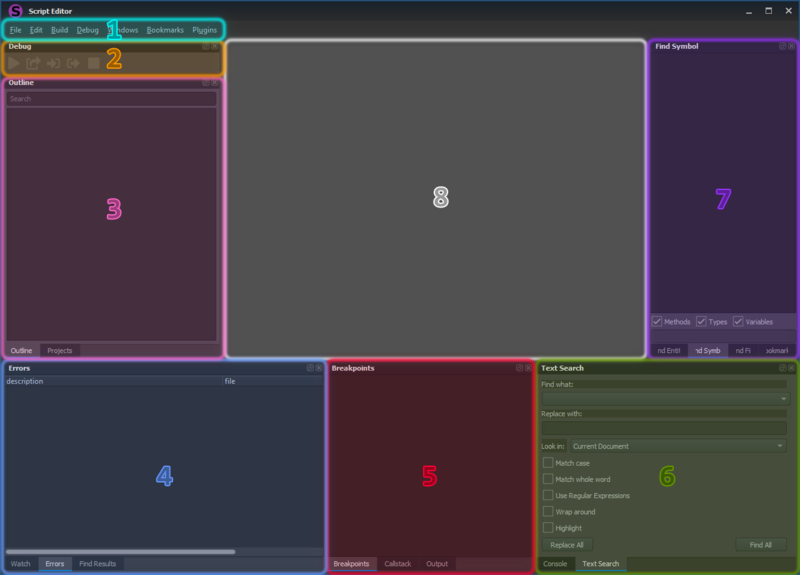
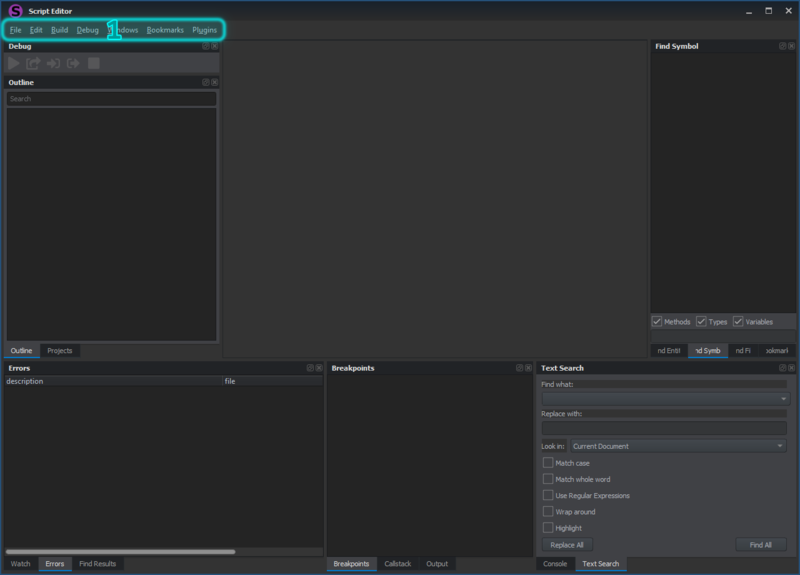
The default (initial) layout of the Script Editor is composed of the following windows and panels, listed in counter clockwise order as seen on the image below.
In order to learn more about individual windows, please refer to individual pages. For information about working with the windows in general, see Script Editor Windows.
- Menu Bar
- Debug
- Outline and Projects
- Watch, Errors and Find Results
- Callstack, Breakpoints and Output
- Console and Find in Files
- Find Entity, Find Symbol, Find File and Bookmarks
- Text Editor
Compilation and Errors
For error management, see Debugging.
Let's start by creating and validating our first script.
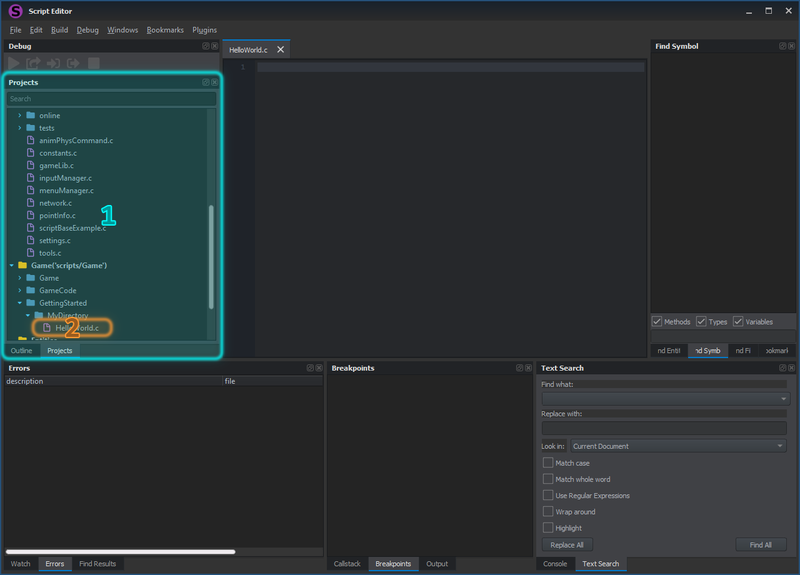
Navigate to the Projects (1) window and open (or create and open) the selected file (2).
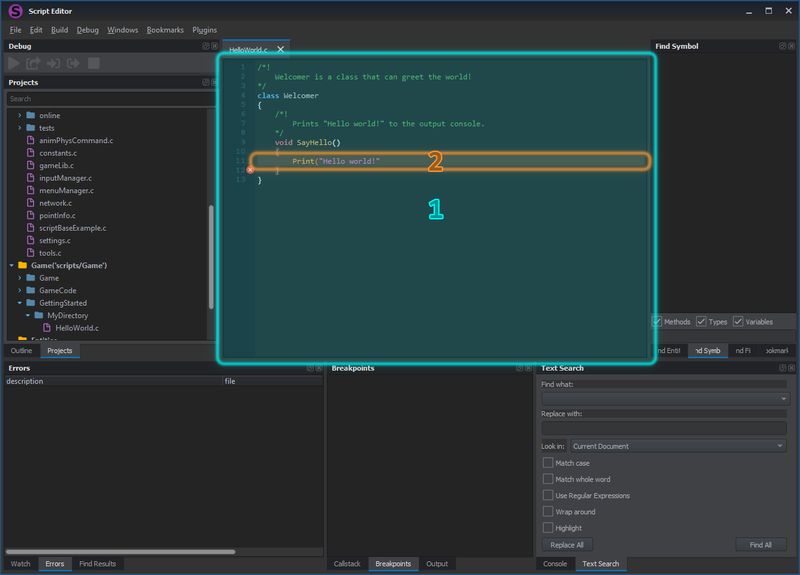
Write the wanted code via the Text Editor (1). In our case we have a class Welcomer that provides us with a void method SayHello.
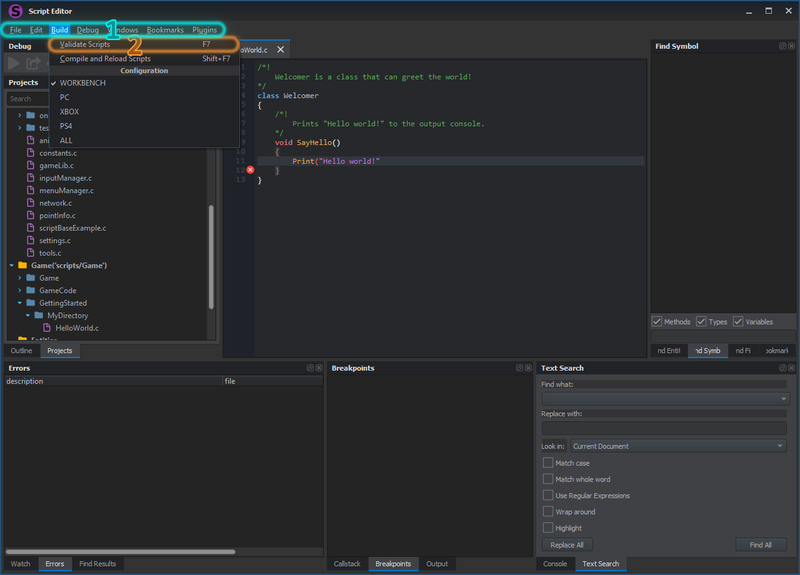
Pay close attention to the syntax error on line 11 (2). We are missing a closing bracket and a semicolon at the end of the line.
Use the Menu Bar to access the Validate Scripts (2) option in the Build tab.
Errors
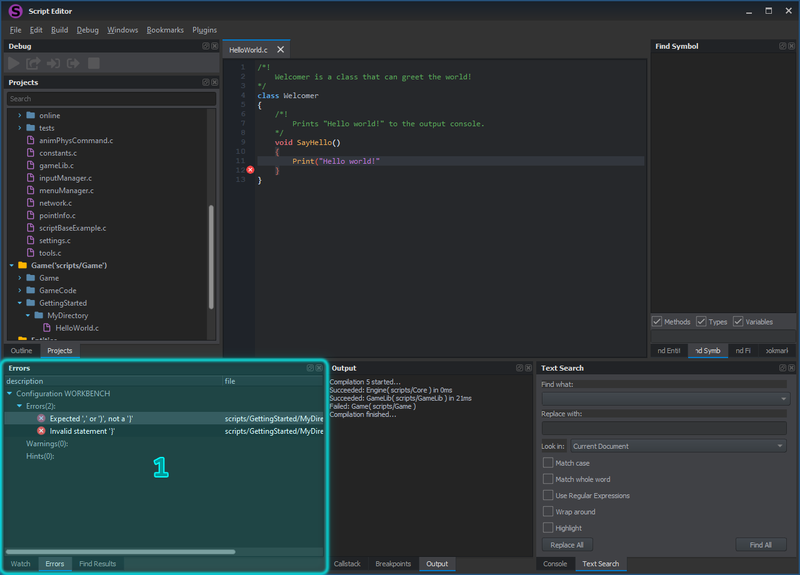
The script validation has resulted in multiple errors that can be seen in the Errors (1) window of the Script Editor.
Double Click ![]() on any error to navigate to its location in the Text Editor.
on any error to navigate to its location in the Text Editor.
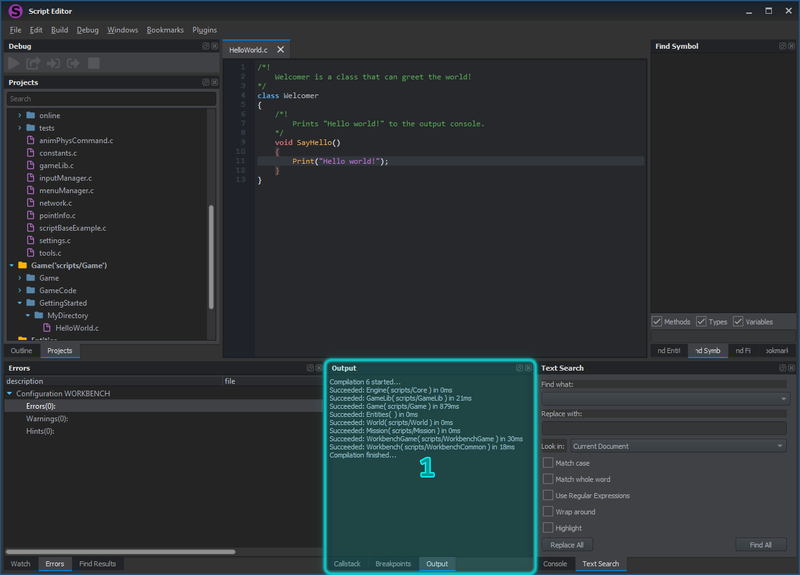
After fixing errors and validating the scripts once again, no problems are found. The Output (1) window then shows that the compilation finished successfully.
Preferences
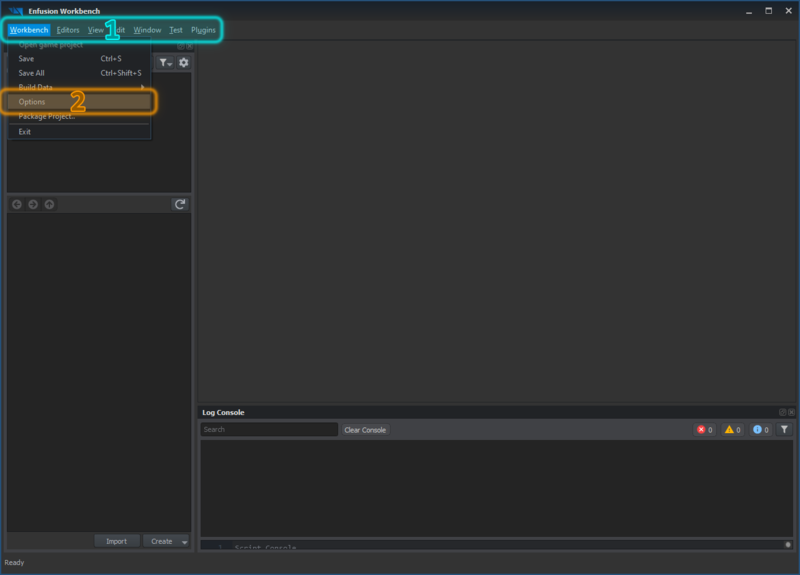
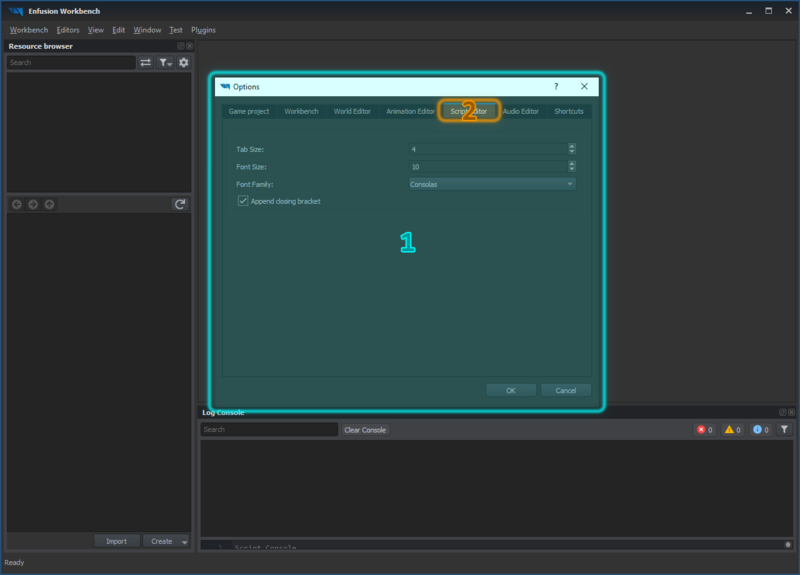
The Script Editor can see some settings adjusted like the font family type and the font size in the Script Editor tab of the Workbench Options.
The Workbench menu bar (1) in the main Resource Manager window allows access to the options by selecting the Workbench → Options (2) entry in the Workbench drop down menu.
The settings can then be personalised in the Options (1) window by editing the properties available in the Script Editor (2) tab.
General
Menu Bar
The menu bar allows access to some of the most sought after features of the Script Editor. The main tabs are:
- File → Provides options of working with files like Save All
- Edit → Provides editing options like Jump To Line, Navigate Back or Duplicate Line
- Build → Provides build options like Validate Scripts or Compile and Reload Scripts
- Debug → Provides debugging options like Debug Client, or Insert Breakpoint
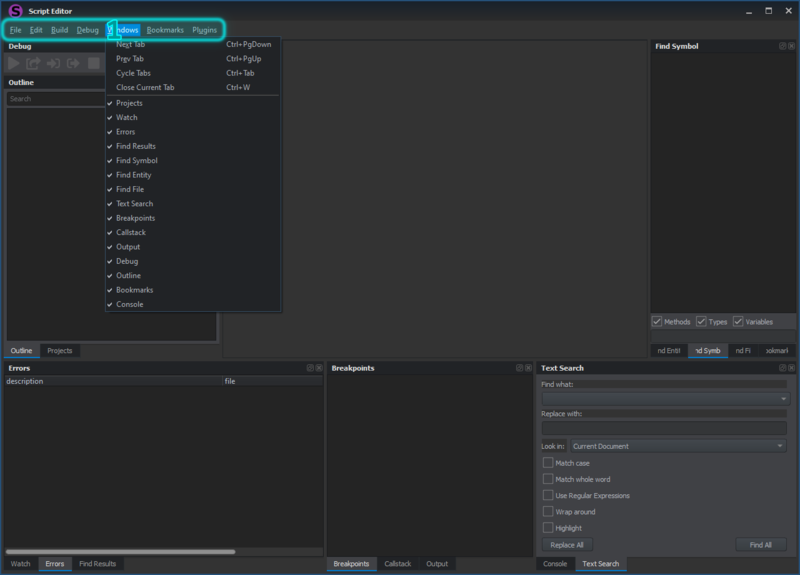
- Windows → Provides the option to open windows like the Projects, Outline or Callstack
- Bookmarks → Provides bookmark options like Toggle Bookmark or Next Bookmark
- Plugins → Provides and general and individual (options per plugin)
Script Editor Windows
Opening and Closing
The Script Editor works with windows which all contribute to the layout of the editor. Windows can be opened and closed by the user at any given time and moved or docked to a certain position within the editor.
A window can always be closed by using Click on the icon in the window title bar. If the window needs to be re-opened, it can be done so via the Menu Bar → Windows (1) option.
Docking and Undocking
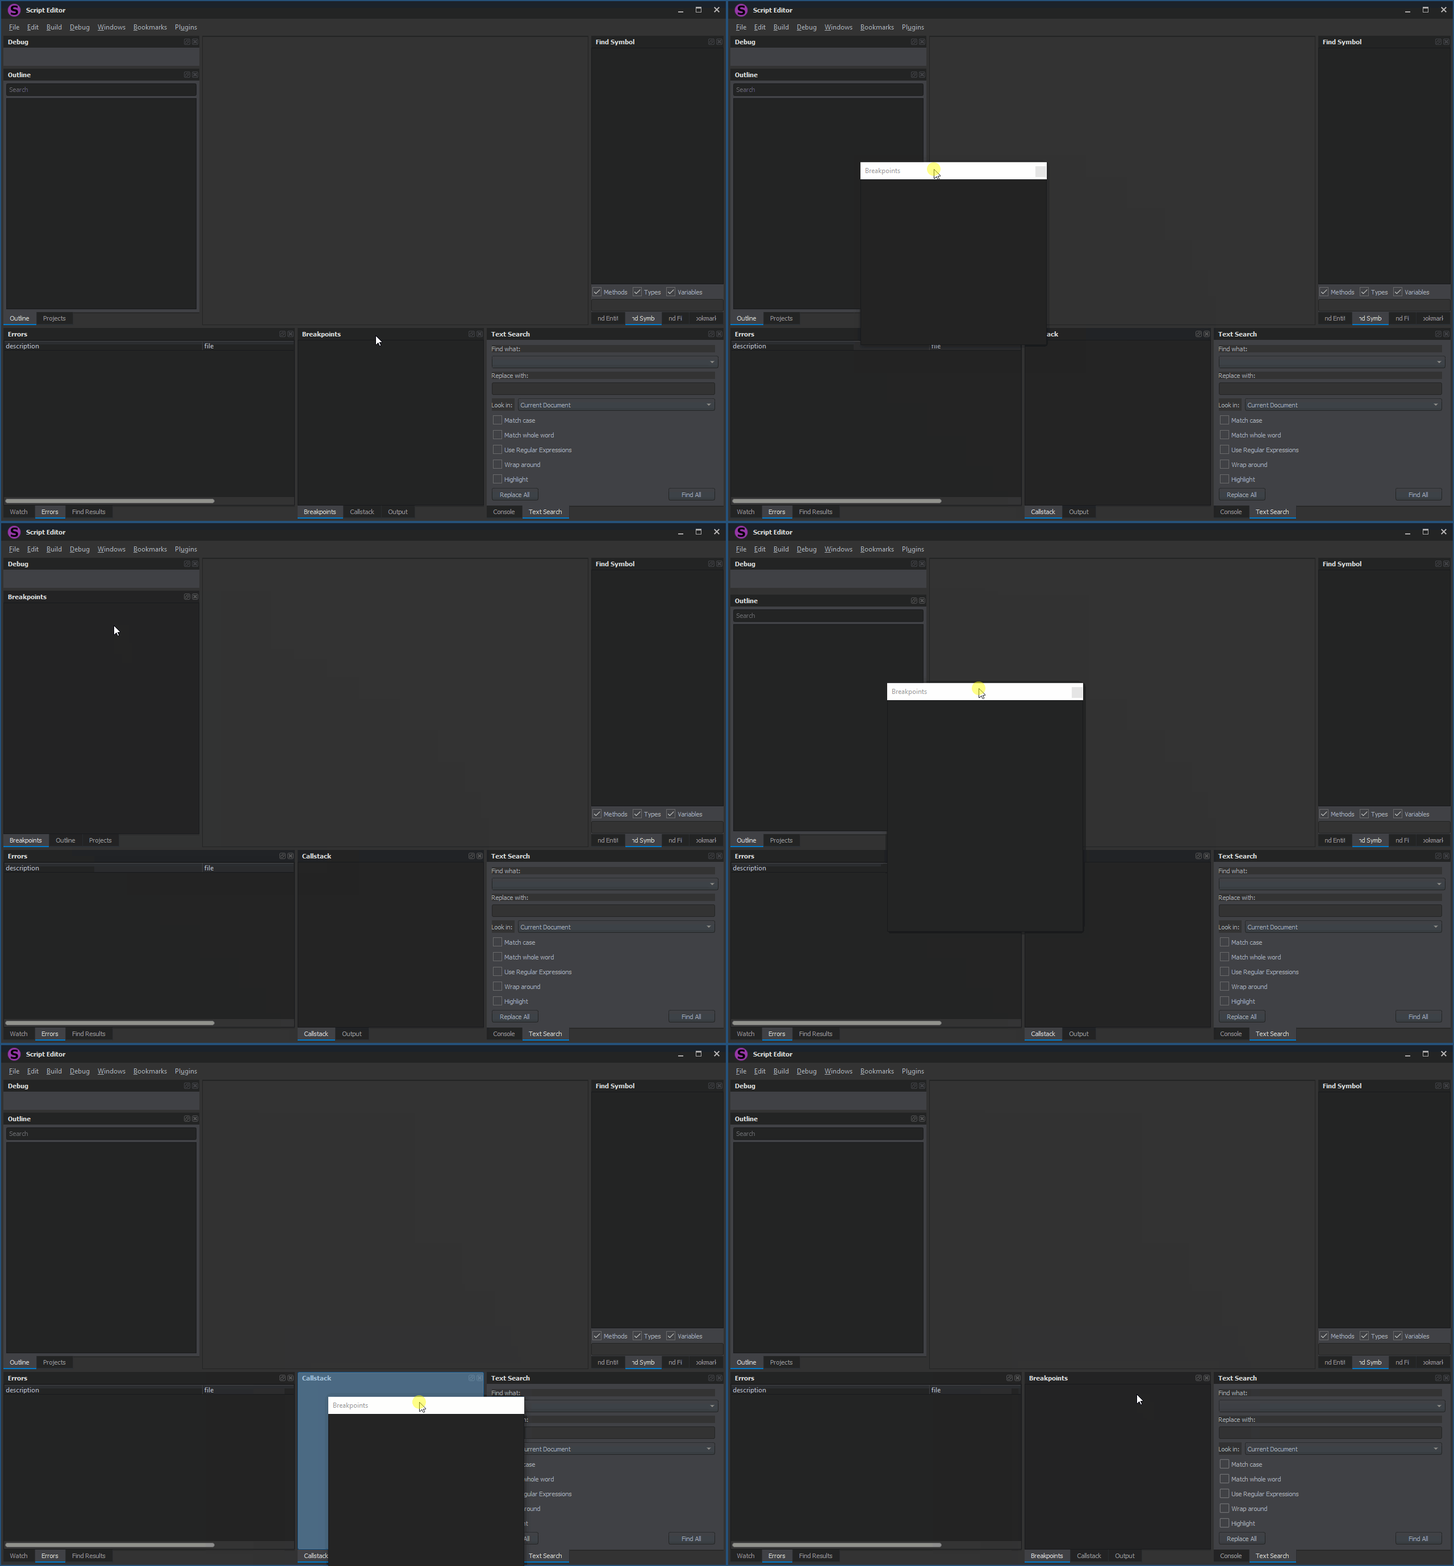
To undock a window from its position, either Click on the button or hover the mouse cursor over the window title bar and hold the Left Mouse Button while dragging the window out.
To dock a window into a different position, keep dragging the windows title by holding the Left Mouse Button . Valid positions where the window can be docked will be visualised by the highlighted area. Release the Left Mouse Button and the window will dock itself.
Projects
Summary
A project is a collection of code files that exists within a particular module.
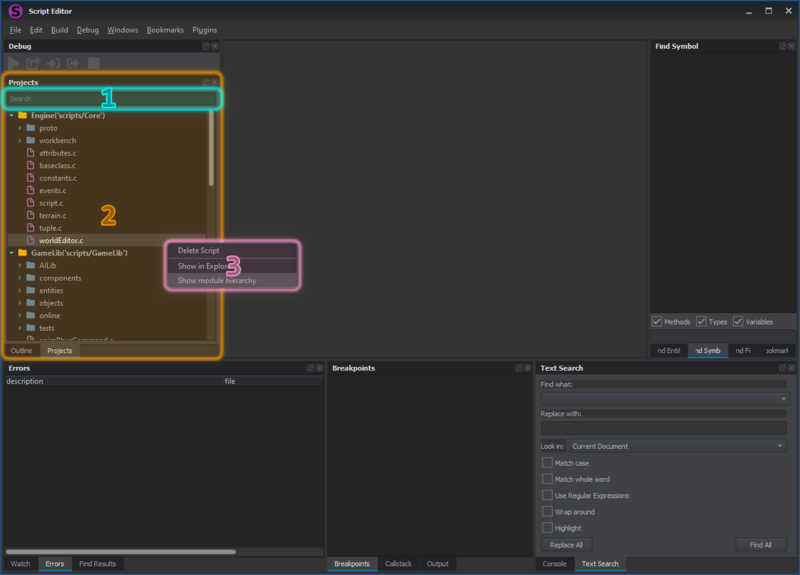
To search for files, use the Search (1) panel that can be found within the Projects (2) window.
Left-click to select any entry from the projects window.
Right-Click on any entry to expand a contextual menu (3) that will provide additional options like removal or navigation to file via Explorer.
Double Click on a selected Script File to open it in the Text Editor.
Icons
All entries visible within the Projects browser use a specific icon representing their type:
| Icon | Description |
|---|---|
| Project | |
| Directory | |
| Script File |
Text Editor
Summary
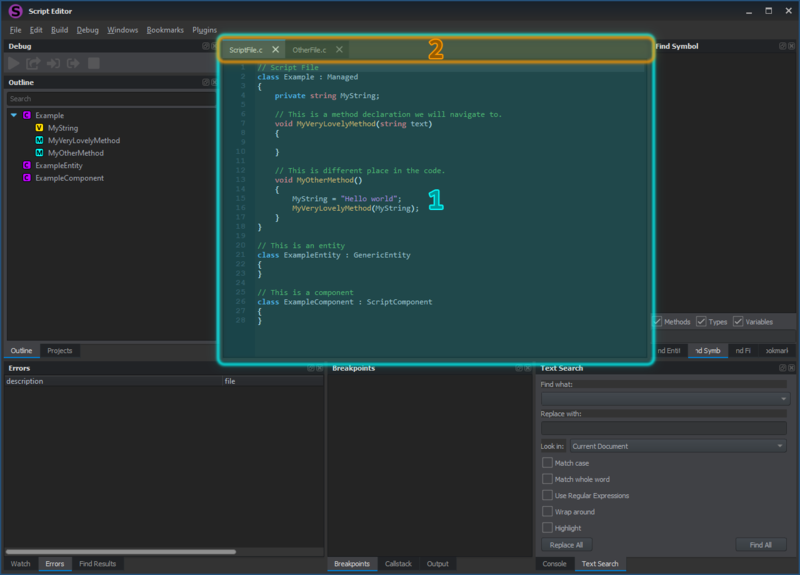
The text editor (1) will allow us to navigate through script files and edit them as desired. The navigation bar (2) can be used to switch between open script files.
Click on any of the open tabs to select them as active or on the icon to close an open tab. Additionally use the Scroll Wheel to cycle between open tabs.
Right Click on any of the open tabs to expand a contextual menu that will provide additional options such as closing multiple files.
Files may be marked as read-only. Such script files can still be opened and read freely, but cannot be modified and saved. An example of such files may be core game data.
Icons
The following icons may appear during Text Editor usage:
| Icon | Description | Information |
|---|---|---|
| Script Error | The script will not compile. | |
| Script Warning | The script will compile, but might yield unexpected results. | |
| Breakpoint (enabled) | User-placed breakpoint in an enabled state. | |
| Breakpoint (disabled) | User-placed breakpoint in a disabled state. | |
| Breakpoint (invalid) | User-placed breakpoint that was invalidated. | |
| Breakpoint Trigger Arrow | Current execution step in the debugger. | |
| Bookmark | User-placed bookmark. |
Auto Complete
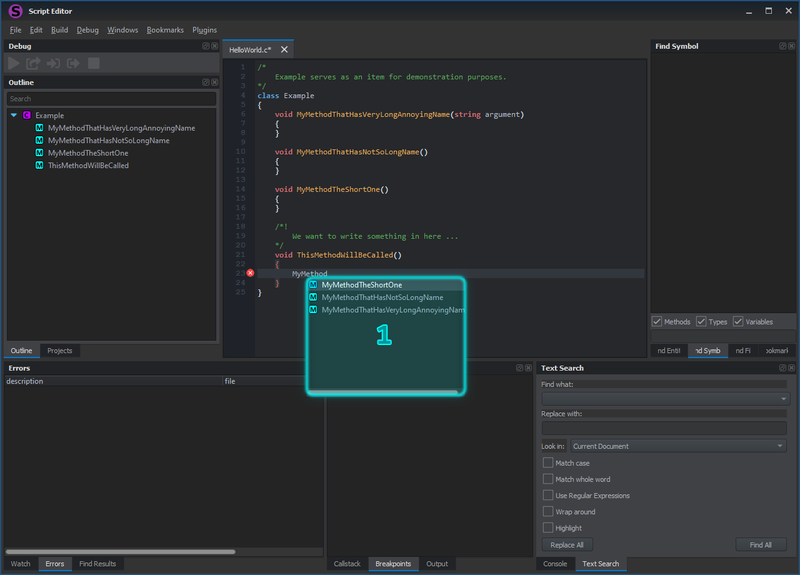
The Script Editor can help fill in code through symbols suggestion with its Auto Completion feature. Simply start writing any code and the Auto Completion Dialog (1) will appear.
Its dialog can browsed through using the Up and Down arrows, confirming selection using Enter or simply by using mouse Click on the desired option. The Auto Completion Dialog (1) can reappear by using the Left Control + Spacebar ( + ) key combination.
Bookmarks
Right Click right next to the Line Number (1) panel in the Text Editor to place or remove a bookmark in code. Placed bookmarks will be visible in the Bookmarks (2) window.
Double Click on any bookmark from within the Bookmarks (2) window to quickly navigate to its location.
Outline
Summary
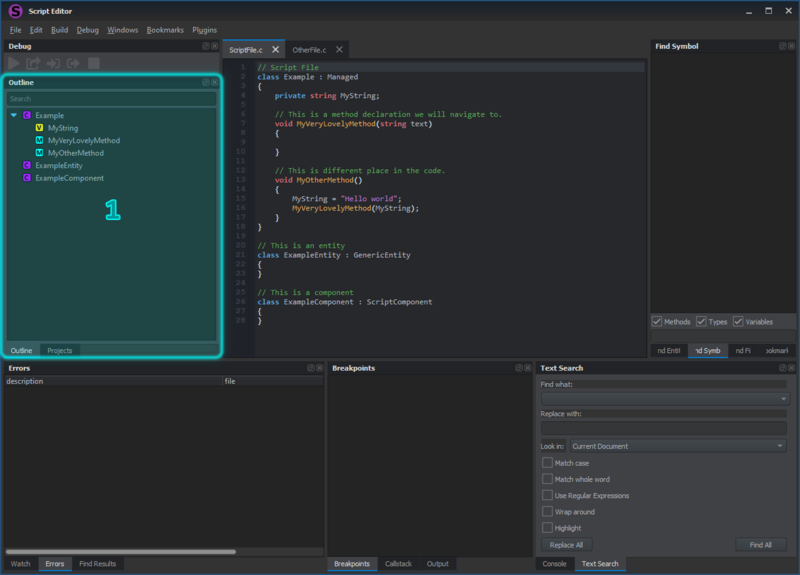
Outline can be used to see and navigate through symbols (i.e. variables, methods, classes etc.) in the currently open document. To search for symbols in the whole solution, use Find Symbol.
Click on any of the symbols in the Outline (1) window to quickly navigate to them in the Text Editor.
Output
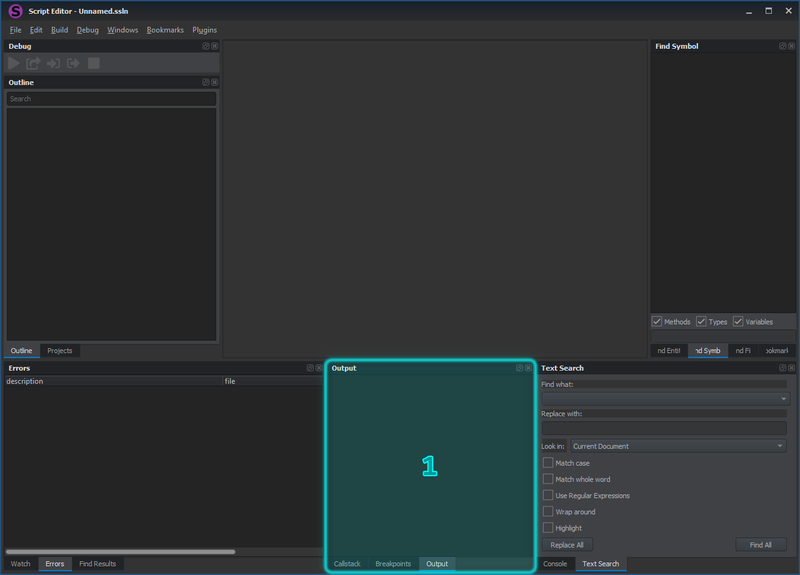
The Output window is especially useful while debugging. All scripts can send diagnostic or other messages to the Output window via the Print method. In addition text can be selected and copied at will.
Searching
The Script Editor also provides numerous ways of searching through the codebase.
Find File
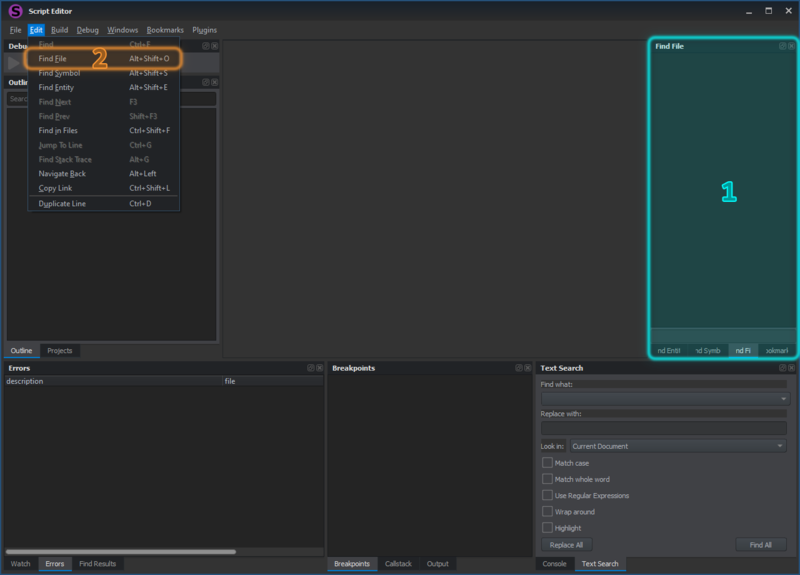
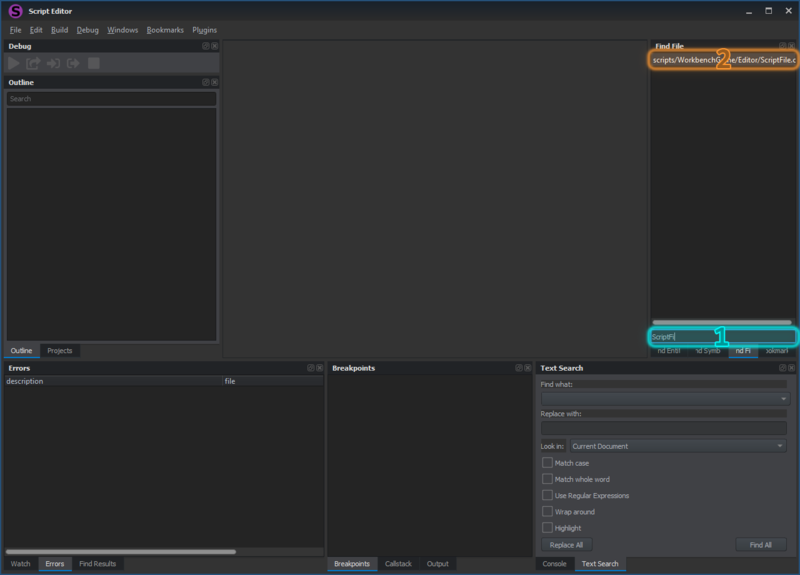
Use Find File to find a script file by name. To search for text in files, refer to Find in Files instead.
To search for a file start by typing into the search bar (1). The results are visible in the search results (2).
Double Click on any of the files in the search results (2) to open and navigate to them in the Text Editor.
Find Symbol
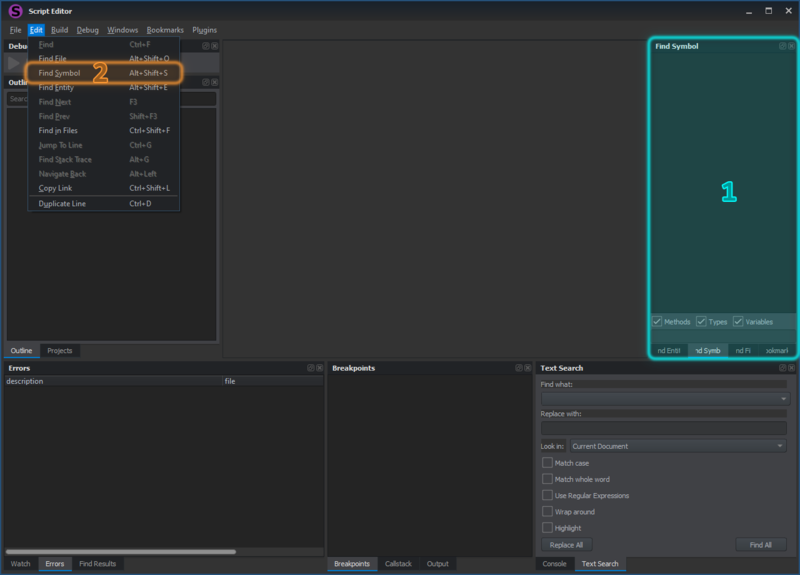
Use the Find Symbol to find a particular symbol located within any of the script files. To search for text in files, refer to Find in Files instead.
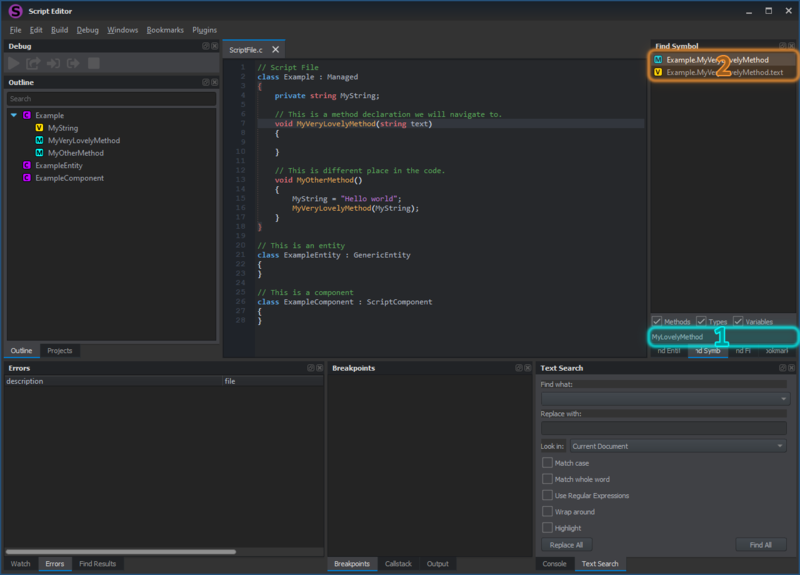
To search for a symbol, type into the search bar (1). The results are visible in the search results (2).
Double Click on any of the symbols in the search results (2) to open and navigate to them in the Text Editor.
Find in Files
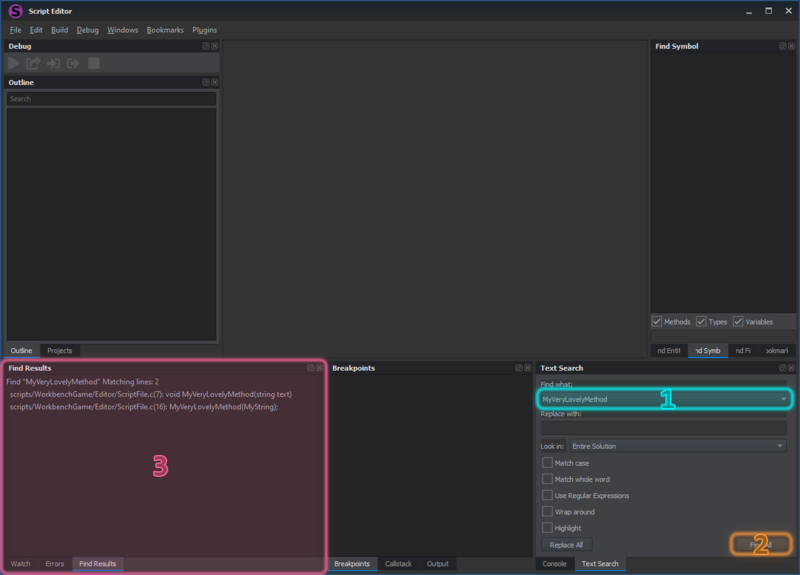
Use Find in Files to search for a text match within any of the script files. To search for symbols, refer to Find Symbol instead. For the search results of the Text Search window see Find Results.
Type into the search bar (1). Click on the Find All (2) button to search. This should open the Find Results (3) window with results.
Click on any of the found results visible in the Find Results (3) window to open and navigate to them in the Text Editor.
Goto Declaration
The Goto Declaration functionality is another navigation tool available from within the Text Editor:
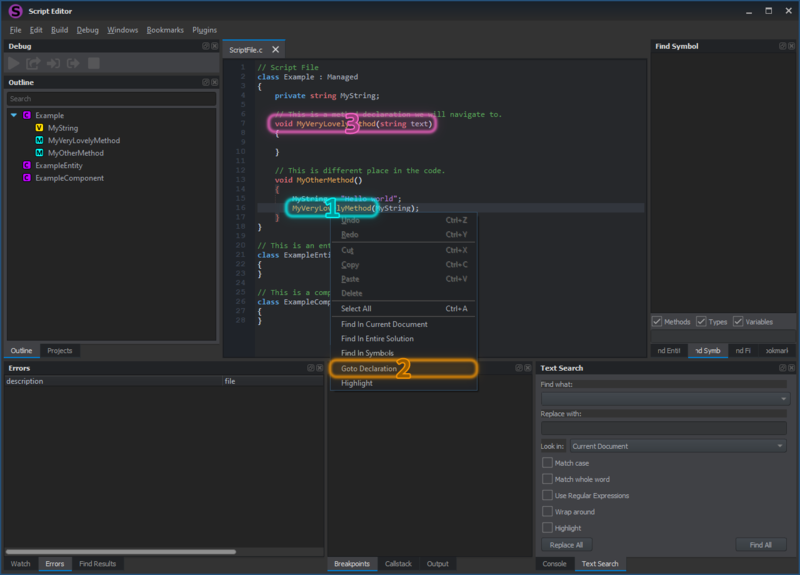
Right Click on any of the symbols (1) in the currently open script file to expand a contextual menu.
Click on the Goto Declaration (2) option in the contextual menu. This will navigate to the symbol declaration (3).
In addition, use Left Control + Click key combination on desired symbol to navigate to the Declaration.
Find in Entire Solution
Navigate the code using the Find in Entire Solution functionality from within the Text Editor.
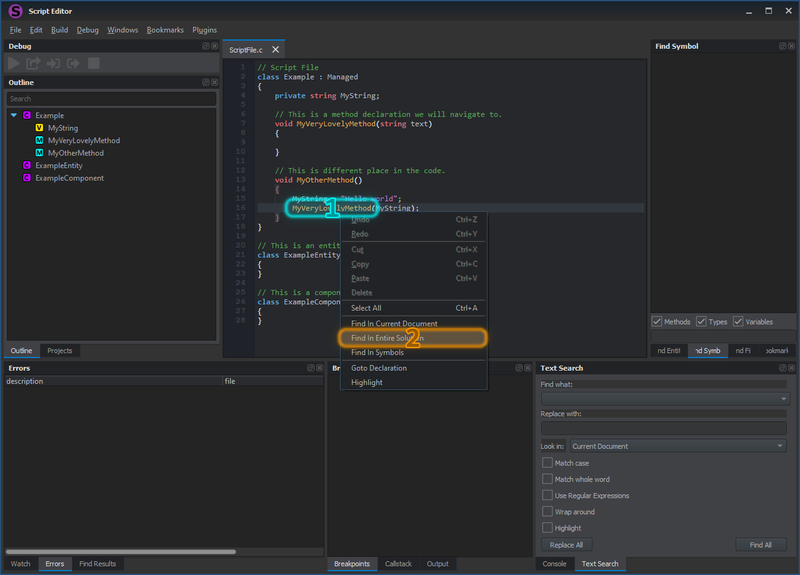
Right Click on any of the symbols (1) in the currently open script file to expand a contextual menu.
Click on the Find In Entire Solution (2) option in the contextual menu. This will perform a project-wide search. For more information regarding searching and finding results, see Find Results.
Find Results
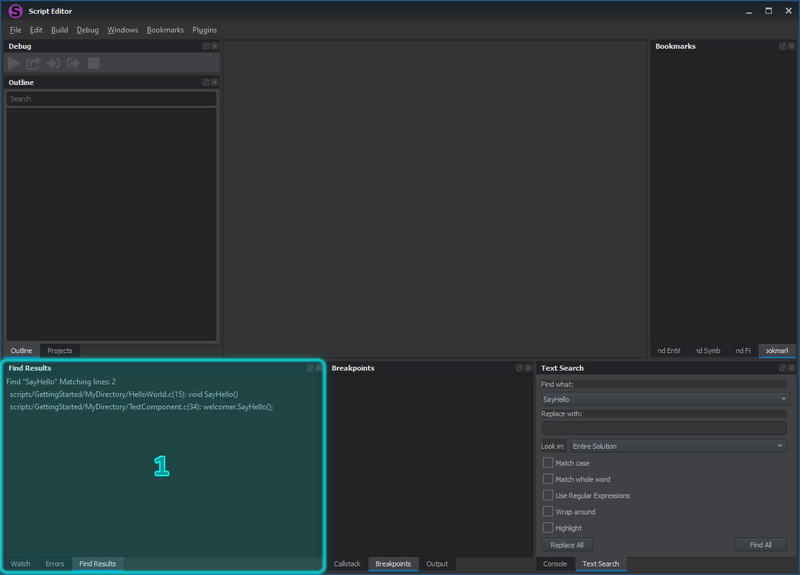
Find Results is a window that provide us with all found results when performing any search via the Script Editor search functionality. See Searching for more information.
Double Click on any of the entries within the Find Results (1) window to navigate to them and open them in the Text Editor.
Find Entity
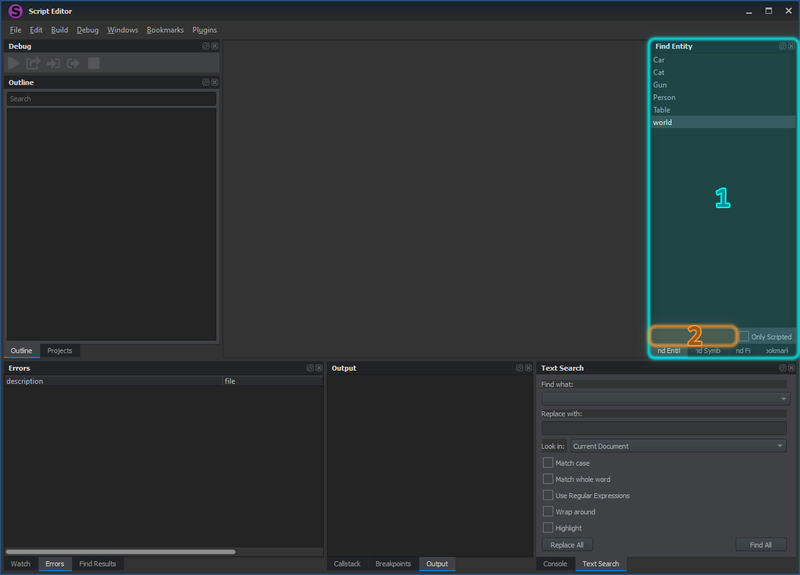
Some entities in the world can be named and have a script associated with them. Such entity scripts can be found via the Find Entity window.
To be able to use the Find Entity option, open a world in the World Editor module of the Enfusion Workbench.
Then, filter for a particular entity by typing into the Search field (2) of the Find Entity window.
Double Click on any of the entries within the Find Entity (1) window to navigate to them and open them in the Text Editor.
Keyboard Shortcuts
Shortcuts are useful to improve the speed and/or efficiency of the Script Editor usage's workflow:
| Shortcut | Function |
|---|---|
| Ctrl + S | Save All |
| Ctrl + O | Open File |
| Ctrl + F | Find in current file |
| Ctrl + ⇧ Shift + F} | Find in all files |
| Alt + ⇧ Shift + O | Find Files |
| Alt + ⇧ Shift + S | Find Symbols |
| F3 | Find Next |
| ⇧ Shift + F3 | Find Previous |
| Ctrl + G | Jump To Line |
| Alt + G | Find Stack Trace |
| Ctrl + |
Find in Symbols, Goto Declaration |
| Highlight selection | |
| F7 | Compile |
| Ctrl + F7 | Compile current file on host (game) |
| F5 | Debug: Continue |
| F10 | Debug: Step Over |
| F11 | Debug: Step Into |
| ⇧ Shift + F11 | Debug: Step Out |
| F9 | Insert Breakpoint |
| Ctrl + F2 | Toggle Bookmark |
| Ctrl + D | Duplicate Line / Selected Text |
| Ctrl + Page Up | Previous Tab |
| Ctrl + Page Down | Next Tab |
| Ctrl + ↹ Tab | Cycle Tabs |
| Ctrl + W | Close Current Tab |
| Alt + ← | Navigate Back |
| F2 | Next Bookmark |
| ⇧ Shift + F7 | Previous Bookmark |
| Ctrl + Spacebar | Show code completion suggestions |
| Ctrl + ⇧ Shift + Space | Show tooltip for current cursor position |
Debugging
Breakpoints
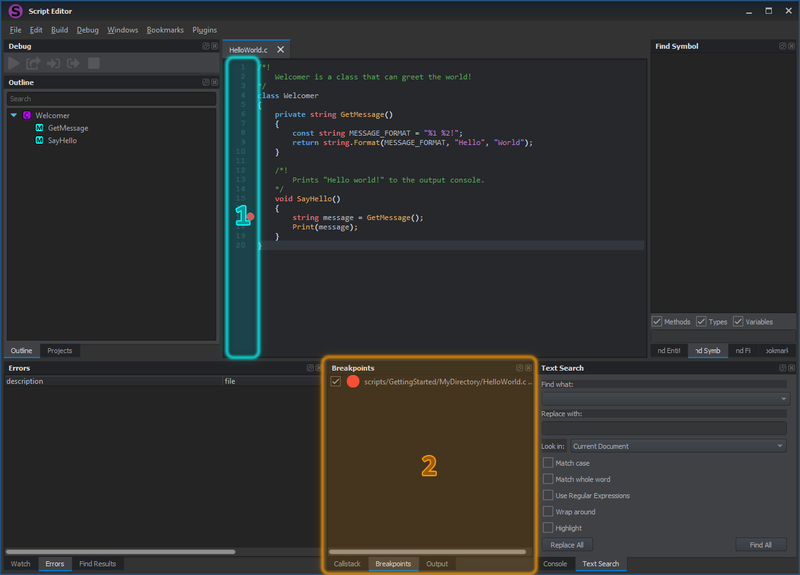
To place or remove a breakpointinto/from code, Click right next to the Line Number (1) panel in the Text Editor or press F9.
The placed breakpoint will then be visible in the Breakpoints (2) window. Breakpoints can be added, removed or toggled at any time, even during run-time.
The checkboxes (/) can be used from within the Breakpoints (2) window to enable or disable given breakpoint.
Disabled breakpoints will not be hit and will simply be ignored.
Breakpoints shown as are invalid and will not be hit by the debugger.
Breakpoints are invalidated if placed in code that does not match the current code run by the connected game.
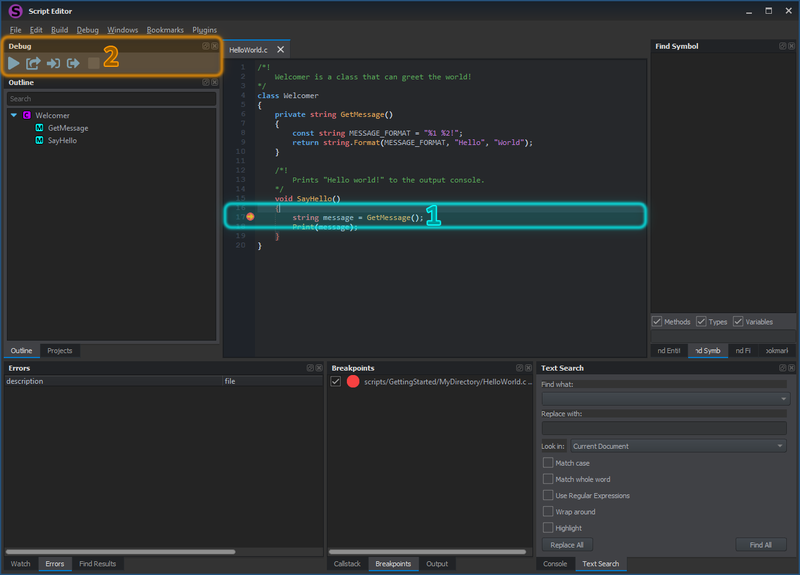
After placing a breakpoint in our code, let's run the game. With an assumption that the code will be executed, we should see theicon pop up over the first encountered breakpoint.
The icon shows the current execution step, as seen on the current line (1). The Debug (2) window can then be used to go through the code execution step by step.
Debug
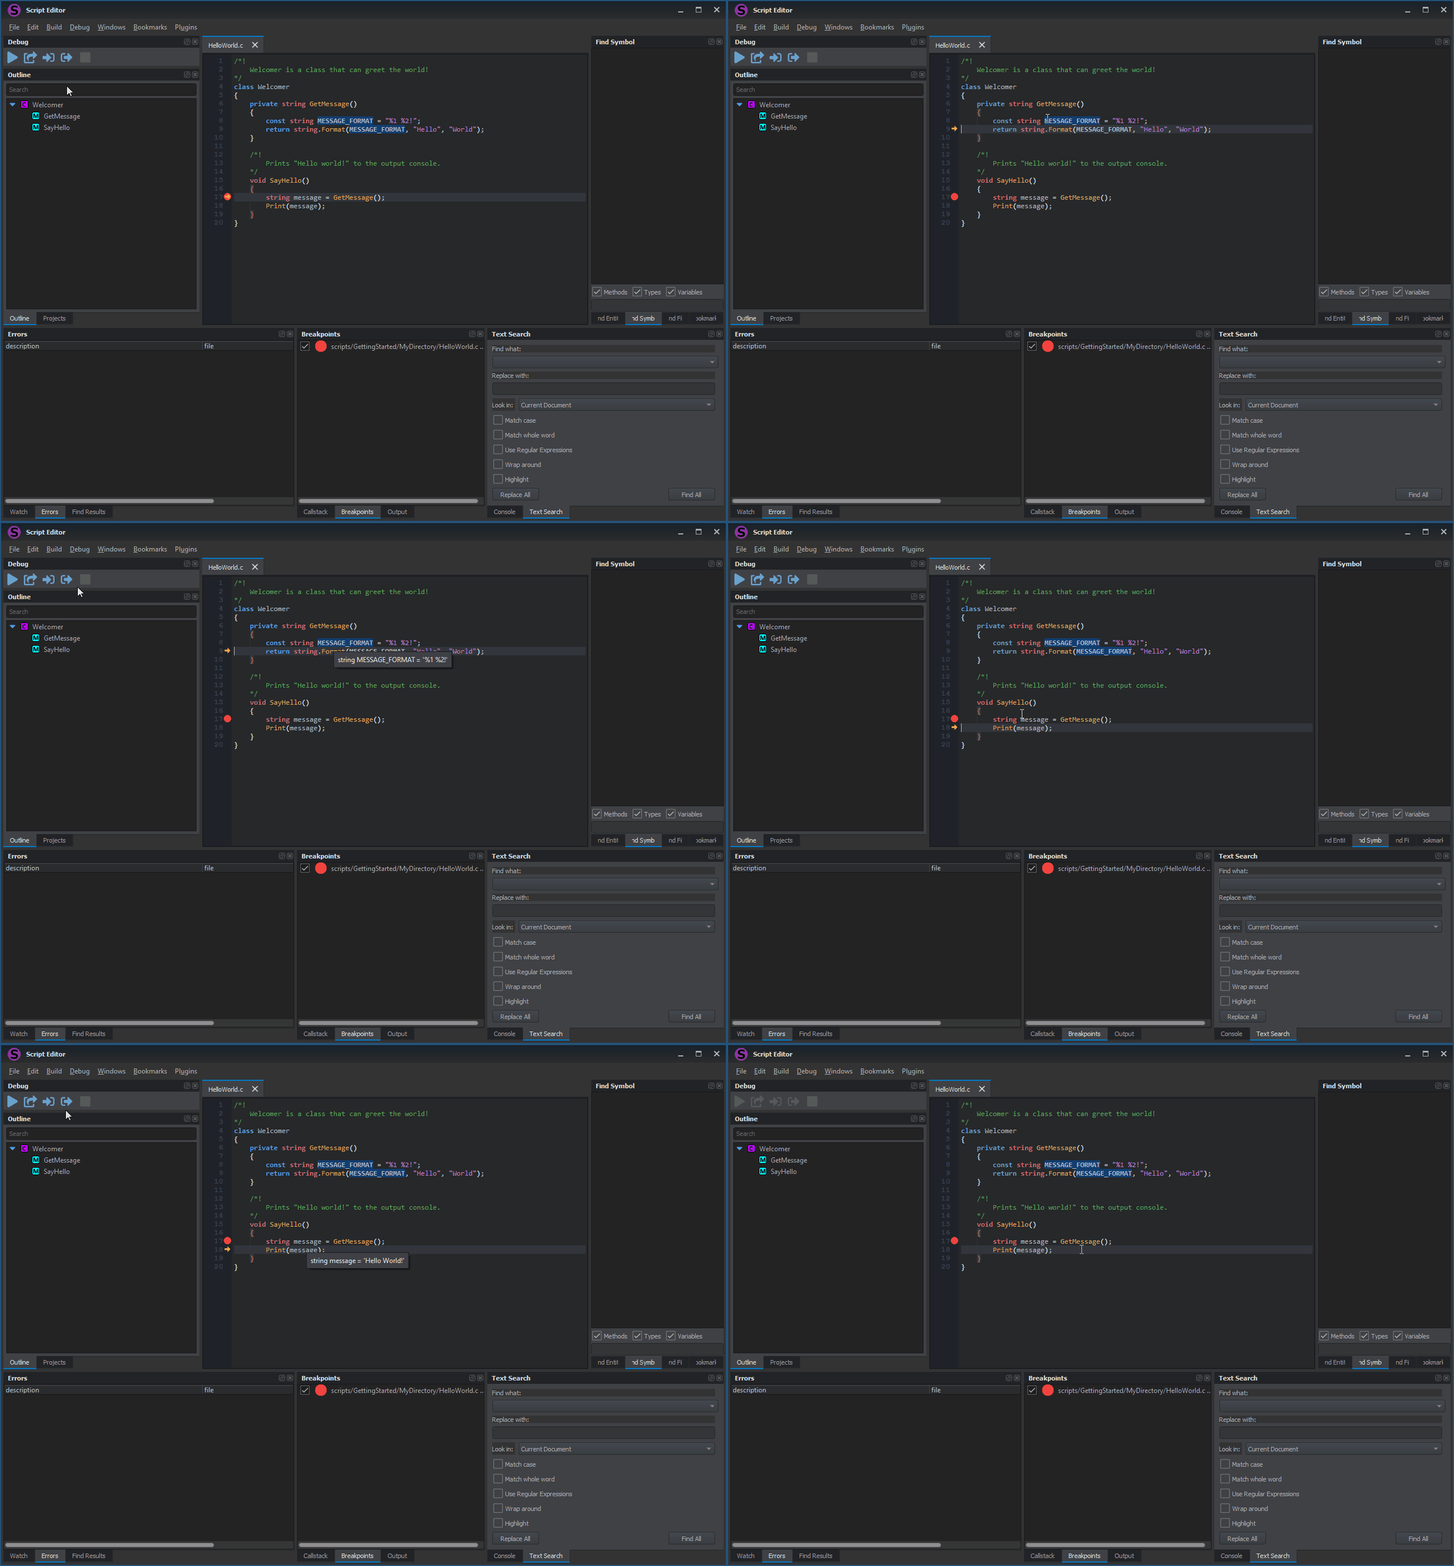
The Debug window then provides us with the following options: Continue, Step Over, Step Into, Step Out and Stop.
- Continue: Continue standard code execution until next breakpoint is hit.
- Step Over: Advance the debugger without stepping into functions or methods.
- Step Into: Advance the debugger one statement at a time.
- Step Out: Advance the debugger until the current function returns.
- Stop: Stop the playmode and current debugging session.
Hovering the mouse cursor over a variable displays its current value, in the addition to Watch usage, explained below.
Connecting the debugger
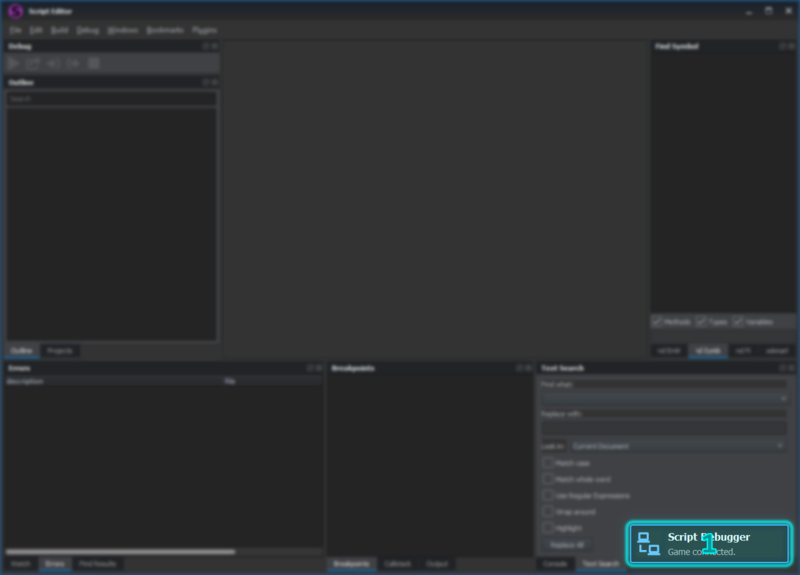
Opening the Script Editor while the game is running automatically attaches the debugger via the default port, displaying the following pop up message (1).
In addition, a debugger can be connected to a different port via the Debug options from the Menu Bar.
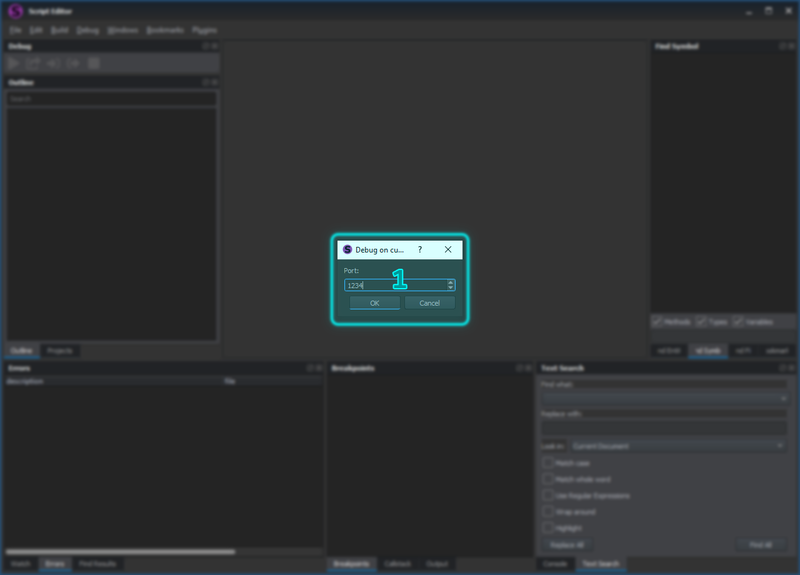
One particularly interesting option is the Debug → Debug Custom, which allows us to connect to a user provided port.
Selecting the Debug → Debug Custom will make the following window (1) appear in which the debugger's port can be set.
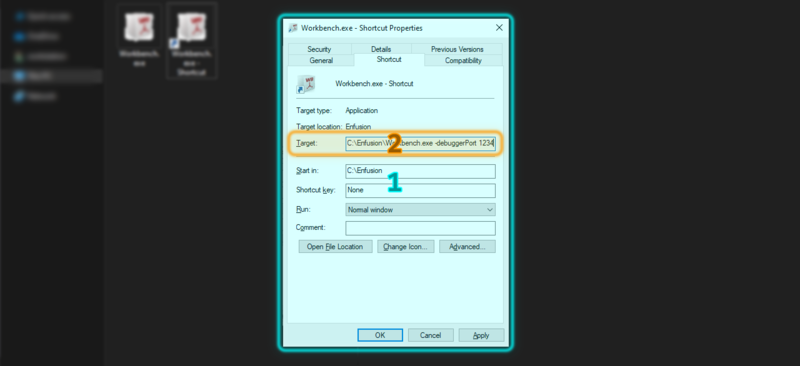
To launch the Enfusion Workbench or the game itself on a specific port, use the -debuggerPort command line argument.
In the following image, the Properties (1) of a Workbench shortcut is set to port 1234 via the argument -debuggerPort 1234 as seen in the Target (2) field.
Watch
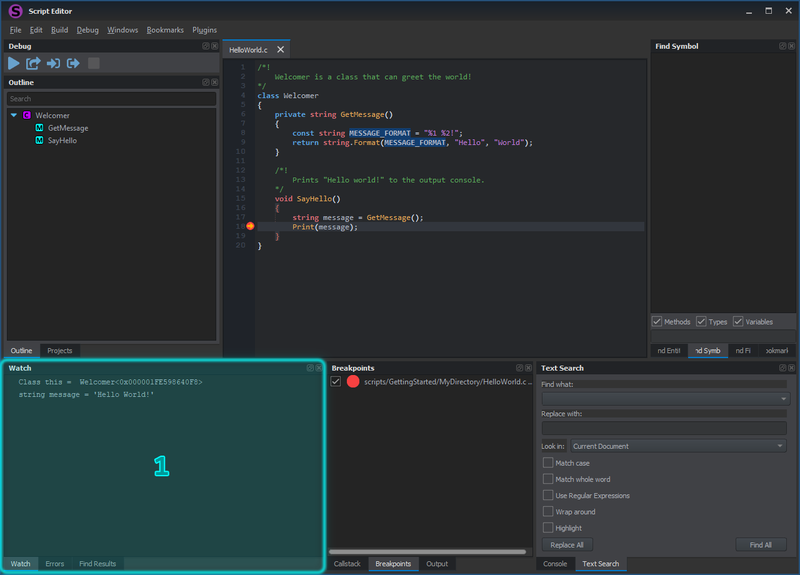
The Watch feature can be used to learn about how code changes in run-time. This allows the user to see the current values of variables while navigating through the code via the debugger.
Callstack
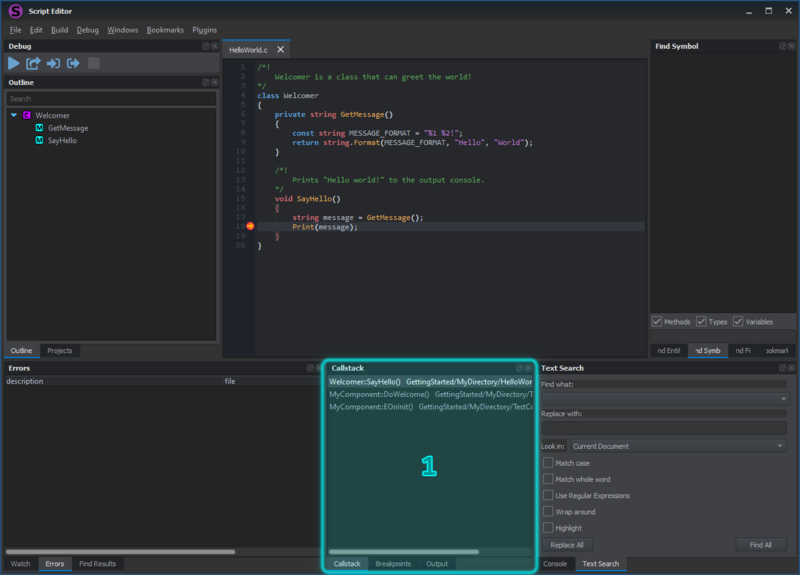
To learn about the code flow in run-time the Callstack feature can be used. This feature shows us the methods' call order.
It must be read from the bottom up. In this case, the depicted call originated in: MyComponent:EOnInit → MyComponent::DoWelcome → Welcomer::SayHello.
Console
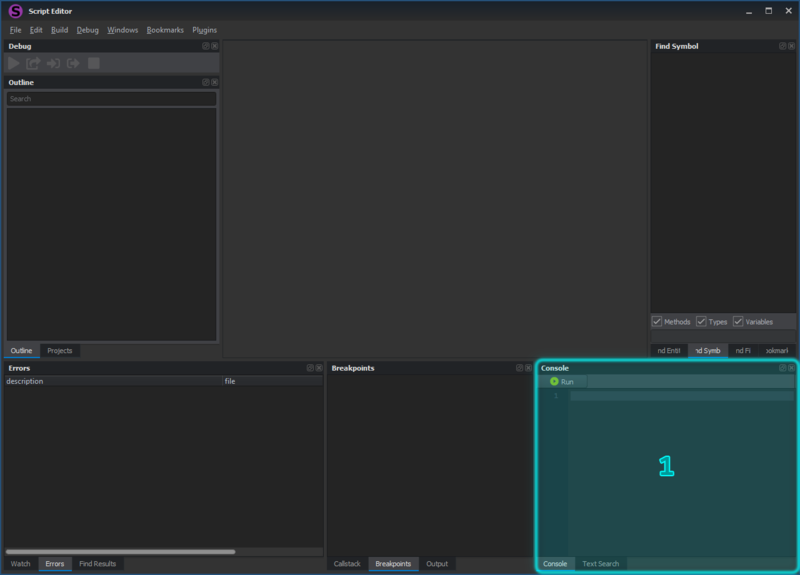
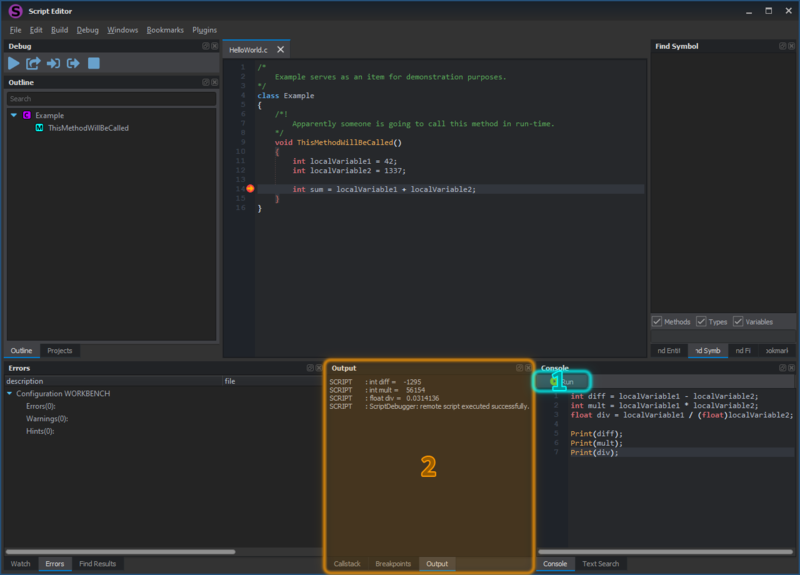
In addition to the Callstack and Breakpoints, the Console is of great debugging assistance. The Console can be used in run-time to execute user scripts within the current stack.
Being in playmode is mandatory to use the console. Code which will be global to the current file can then be run. The console can also be used when a breakpoint is hit while debugging and the run code will be local to the current instance. For more information regarding breakpoints see Breakpoints.
Write code into the console and press the Run (1) button. Local variables can be used; for more information see Watch.
Results will be visible in the Output (2) window.
Virtual Machine Exceptions
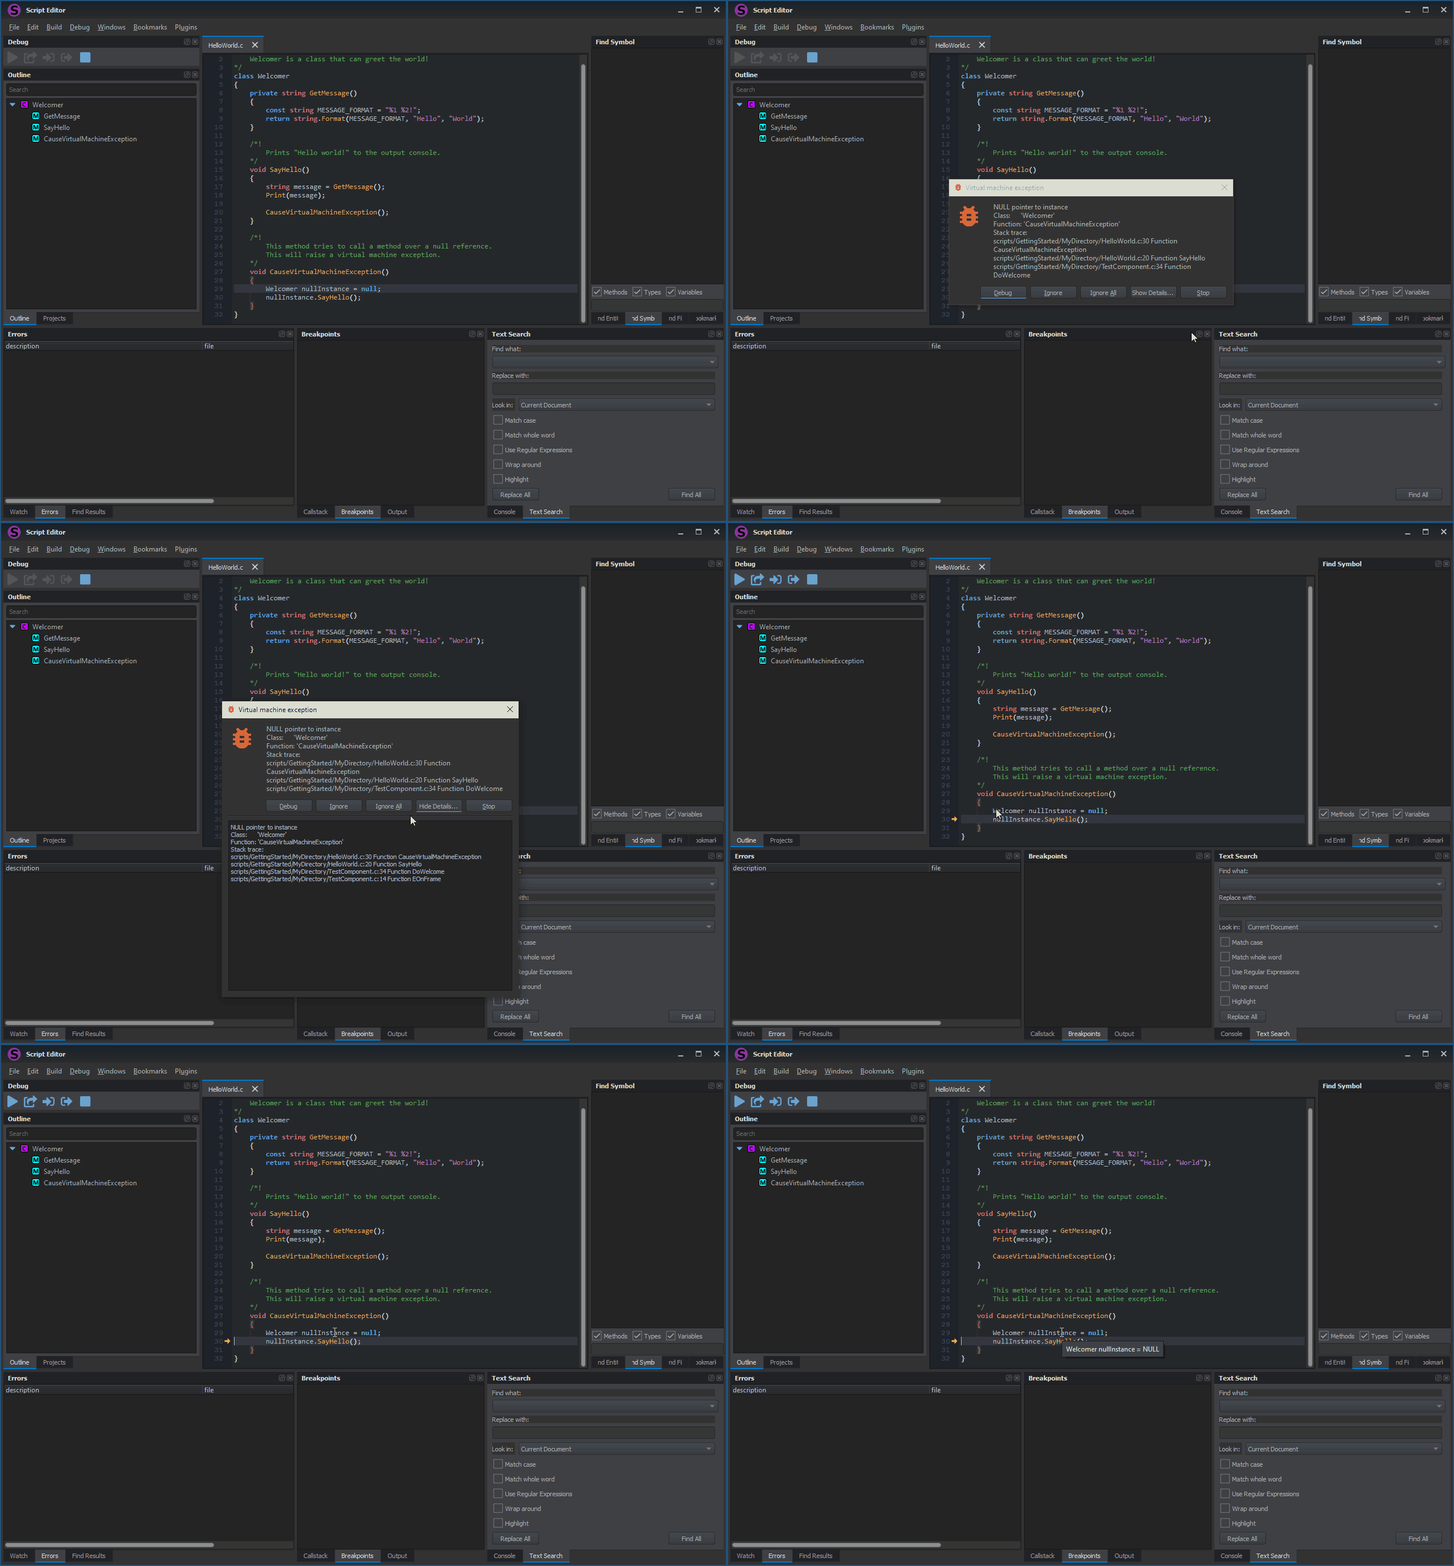
From time to time, unhandled code may be encountered - like in this example below, where we are trying to call a method via a null reference. In such cases a Virtual Machine Exception will be raised.
Press Stop to halt the code execution immediately, ignore single or all cases via Ignore and Ignore All, or navigate straight to the problem using the Debug button.
