Debug Console – Arma 3
![]() 0.54
Configuration in Take On Helicopters differs, Mission Editor: Debug Console (Take On Helicopters)
0.54
Configuration in Take On Helicopters differs, Mission Editor: Debug Console (Take On Helicopters)
Debug Console is an editing tool giving designer ability to check various states and execute custom code on the fly.
Access
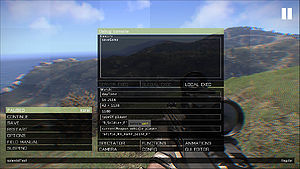
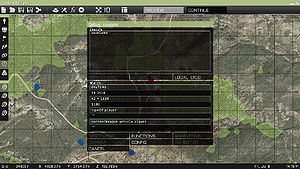
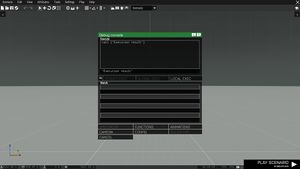
While playing a mission from the editor, the console is immediately available in pause menu. In old 2D editor map screen, you can open in by clicking on "Debug Console" button or using Ctrl+D shortcut. In Eden editor it is available under Tools -> Debug Console.
In multiplayer, the debug console is unavailable by default. It is possible to make it available by configuring access option (see below). It is worth noting that when debug console is configured for admin access, it is only available for logged in admin, voted in admin is treated just like any other user in this respect.
Configuration
The console is automatically available in missions running from editor. If mission designer wishes to enable it elsewhere, he can achieve it in one of the 3 ways:
- Using mission config param. You can add "\a3\functions_f\Params\paramDebugConsole.hpp" mission parameter, where server host / admin can choose whether or not he'll allow debug console.
- Using following Description.ext param, for example:
enableDebugConsole = 1;
Possible values:
0 - Default behavior, available only in editor
1 - Available in SP and for hosts / logged in admins in MP
2 - Available for everyone
- Using Eden attribute Debug Console, available in Attributes -> General -> States -> Debug Console
- Using global/mod config param, for example:
enableDebugConsole = 2;
Whitelisting Multiple Users
Since Arma 3 v1.71 it is possible to let more than 1 person access debug console in Multiplayer. This is done by defining enableDebugConsole param as Array and adding UIDs of whitelisted users to this array, for example:
enableDebugConsole[] = {"81273982178973213", "3749832749732749", "7492374983274234"};
All users with UIDs matching the added UIDs will be able to access debug console in Multiplayer. Additionally, server host will also be able to use debug console, as well as any logged in admin on dedicated server.
Mod support
Since Arma 3 v1.71 it is possible to configure debug console availability with a mod param enableDebugConsole. This param is checked if no debug console option is set in the mission. If a server admin would like to make debug console available for a group of trusted people, he can create a custom mod, for example with:
enableDebugConsole = 2;
Then sign it and distribute between trusted people. This way anyone who has this custom mod signed with correct signature, will be able to connect to the server and use debug console. Default mod setting is 0.
Order of Precedence
- Mission param is checked. If is not defined then...
- description.ext param enableDebugConsole is checked. If is not defined then...
- Eden attribute option is checked. If not defined then...
- Global/mod param enableDebugConsole is checked.
BattlEye Filters
Debug Console uses Remote Execution. If you wish to exclude Debug Console execution from BE Filters, add this to your remoteexec.txt
!="BIS_fnc_debugConsoleExec \[[0-2],\{.*\}\]"
Features
- Expression field
- Value is saved when console is closed and restored again upon return
- The expression can be executed by one of the following buttons:
- Local - execute on player's computer using remoteExec to call given code.
- Global - execute on all computers using remoteExec to call given code. Enabled only in MP
- Server - execute on server only using remoteExec to call given code. Enabled only in MP
- Performance Test - See: BIS_fnc_codePerformance
- 4x Watch field
- Value is saved when console is closed and restored again upon return
- When code is taking too long to evaluate (>0.003s), the background turns orange and the value is not saved
- Watch fields execution paused when user edits the watch expression, and resumes on change of focus or enter key
- Execution result field (Arma 1.72 + )
- The execution result field shows result of local execution of the expression code
- In MP the execution result field shows remote result for server execution
- Buttons (All of the following buttons close the pause menu and open some another window)
- Spectator camera
- Splendid Camera
- Functions viewer
- Config Viewer
- Animation viewer
- User Interface Editor
Profile Saving
The debug console automatically saves each field as you go, Even after game restart. These can also be access using profileNamespace getVariable with the following code:
- Expression Field
profileNamespace getVariable "rscdebugconsole_expression";
- 4x Watch Field
profileNamespace getVariable "rscdebugconsole_watch1";
profileNamespace getVariable "rscdebugconsole_watch2";
profileNamespace getVariable "rscdebugconsole_watch3";
profileNamespace getVariable "rscdebugconsole_watch4";
Using the same variables you can also clear or change the fields.


